User guide
Extended Lines
Accessing the tool
The Extended Lines are drawing tools. Access it in one of the following ways:
From the Drawing Tools menu:
- Open the Drawing Tools menu.
- Select your desired line type from the list of “Horizontal line from…”.

Quick access methods:
- Add the tool to the Drawing Tools Tile indicator for one-click access.
- Assign a hot key for instant activation via keyboard shortcut:
- Open the NinjaTrader Control Center.
- Go to Tools -> Hot keys.
- Assign your preferred key combination.
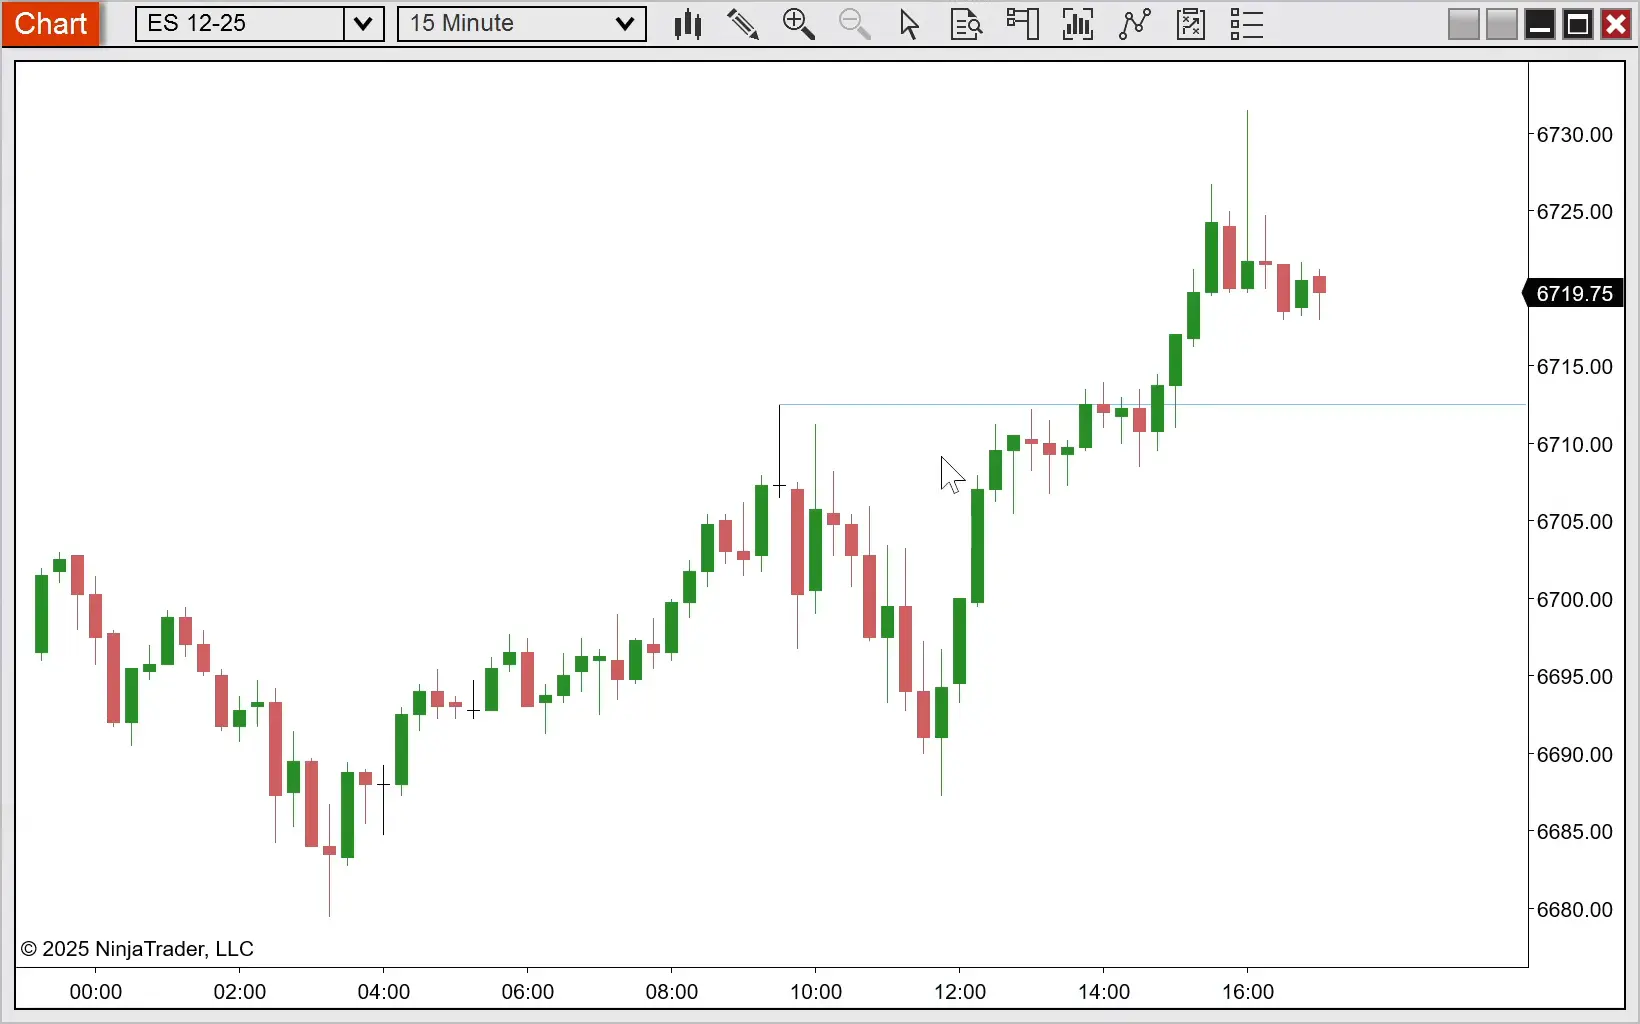
Drawing a line
Click on any bar on the chart to instantly draw a line. The line starting point is automatically determined by the bar’s price points based on the selected line type. For example, selecting “Horizontal line from Bar High” draws a line starting at the high of the clicked bar.
Understanding the tool Properties
The screenshot below shows all available properties for Extended Lines. Each property is explained in detail in the sections that follow.

General

Attach to
By default, Extended Lines drawings are attached only to the chart they were drawn on, making them visible only on that specific chart (local drawing object). This parameter allows you to change the line to a global drawing object by selecting the instrument name followed by “(All charts)” from the dropdown menu.
Local vs. Global Drawing Objects:
Local: The line is visible only on the specific chart where it was drawn. Local lines are lost when the chart is closed.
Global: The line is visible on all charts of the same instrument, including any new charts opened for that instrument. Global lines are stored persistently—even if you close all charts of that instrument, the line will reappear when you open a new chart for the same instrument.
Example: Changing “Attach to” from “MES 03-26 5 Minute” to “MES 03-26 (All charts)” makes the line visible on all MES 03-26 charts, regardless of the time frame.
Note: Additionally, a line can be attached to an indicator so that it will be associated with the indicator and its scale.
Auto scale
When enabled, the line is included to the auto-scaling of the chart so the vertical axis of the chart will be adjusted such that the line drawing will always be visible.
Locked
Enable this property to automatically lock lines after drawing them, preventing accidental repositioning when scrolling your chart. To apply this property to all new lines, save it as your Default Template (Template > Save > Save as Default).
Hot tip: When the line is not locked:
- Hold the Shift key down to move the selected anchor on the horizontal axis only.
- Hold the Alt key down to move the selected anchor on the vertical axis only.
Tag
A custom identifier that can be assigned to the line for organizational purposes or for use with automated trading strategies.
Interval visibility
Controls on which chart intervals the line is visible. Choose from the following options:
All
Line is visible on all chart intervals.
Draw_on_only
Line is visible only on the chart interval where it was drawn.
Example: Drawing on 60-minute chart means it’s only visible on 60-minute charts.
Draw_on_and_below
Line is visible on the chart interval where it was drawn and all lower (shorter) intervals.
Example: Drawing on 60-minute chart makes it visible on 60-minute, 15-minute, 5-minute, etc., but hidden on daily charts.
Use this to avoid clutter when viewing higher chart intervals.
Draw_on_and_above
Line is visible on the chart interval where it was drawn and all higher (longer) intervals.
Example: A line drawn on a 60-minute chart is visible on 60-minute, daily, weekly, etc., but hidden on 15-minute charts.
Selected_Interval
Line is visible only on a specific chart intervals defined in the “In Interval visibility = Selected_Interval” section below.
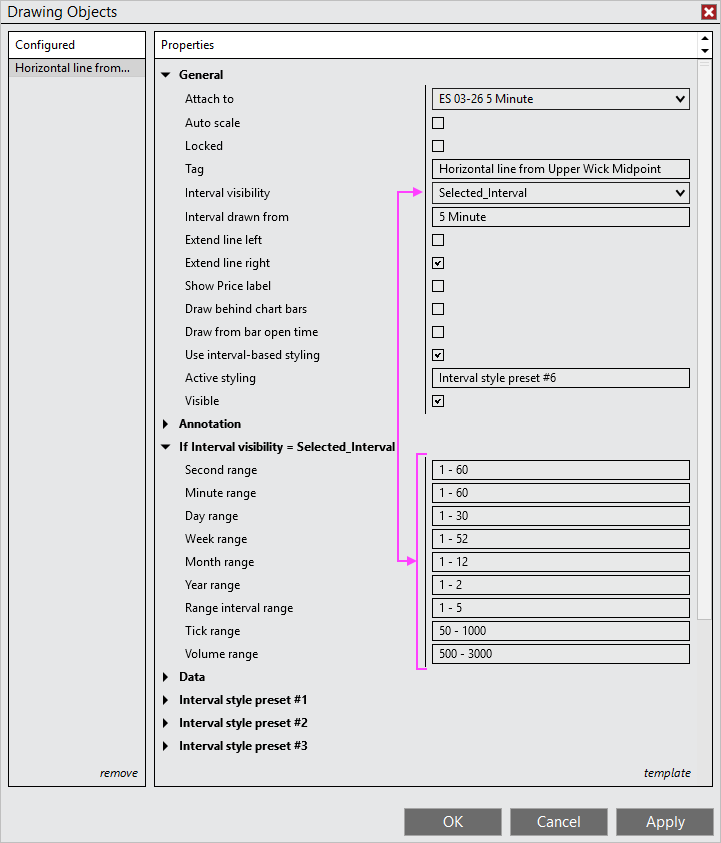
As shown in the image above, the line will be visible on a second chart with intervals from 1 to 60 seconds. If the second chart interval is 90 seconds, the line will not be visible.
The range for each interval type can be adjusted by entering two integer numbers separated by a dash ‘-‘ character.
To make the line visible only on a specific chart interval, enter the same value twice. For example, to display the line only on 15-minute charts, enter 15 – 15 in the Minute range field.
Interval drawn from
This is a read-only parameter that displays the chart interval from which the drawing was originally created.
Use this parameter as a reference when a drawing is unexpectedly visible or hidden on a particular chart interval. The Interval visibility setting controls on which chart intervals the drawing is displayed, and its behavior depends on the chart interval the drawing was drawn from. Knowing the originating chart interval helps you understand why a drawing may or may not be visible on the chart you are currently viewing.
Extend line left
When active, the left side of the line extends to the left edge of the chart. This property can also be activated or deactivated from the right-click context menu.
Extend line right
When active, the right side of the line extends to the right edge of the chart. This property can also be activated or deactivated from the right-click context menu.

Cut drawing here
From the right click menu, there is an option called Cut drawing here. When clicking on this menu selection, the line will be cut where the mouse cursor was when right clicked.

Show price label
When this property is active, a price label will be visible for the price values of the top and bottom of the line. A price label will also be drawn for the visible divider lines.

Draw behind chart bars
By default, lines are drawn in front chart bars.
To draw them behind, enable this property and save as Default Template (Template > Save > Save as Default). All future lines of this type will be drawn behind of chart bars.
Note: This property must be saved in a Default Template to take effect.
Draw from bar open time
When active, the line aligns to start at the bar’s opening time. This feature works with Month, Week, Day, and Minute chart intervals. On lower chart intervals, the line begins at the opening time of the bar where the drawing was initiated.
When inactive, the line uses NinjaTrader’s default bar snapping, which aligns to the bar’s closing time.

Use interval-based styling
The property “Use interval-based styling” is active by default, which automatically sets the line’s style and color based on the chart interval where it is drawn. Custom line styles (outline color and style, fill color and opacity) can be defined for up to 9 chart intervals using the “Interval style preset #1 to 9” sections.

Up to 9 chart interval presets can be configured in the sections below. A single chart interval can be specified by entering one number in the Interval value field, as shown in Interval style preset #3 for the Day interval type. Alternatively, a range of chart intervals can be defined by entering two numbers separated by a dash ‘-‘ character, as shown in Interval style preset #5 for the Minute interval type.

When the property “Use interval-based styling” is not active the lines will always be drawn with the same color as defined by the properties under the “Static style (all intervals)” section:
- Outline if not using interval-based styling
- Fill color if not using interval-based styling
- Fill opacity (%) if not using interval-based styling

Active styling
Shows which style template is currently used for drawing the line. This property is read-only.
Visible
Controls whether this drawing is displayed on the chart. Unchecking this parameter hides this Extended Line without deleting it, allowing you to temporarily remove it from the chart view and restore it later.
Annotation
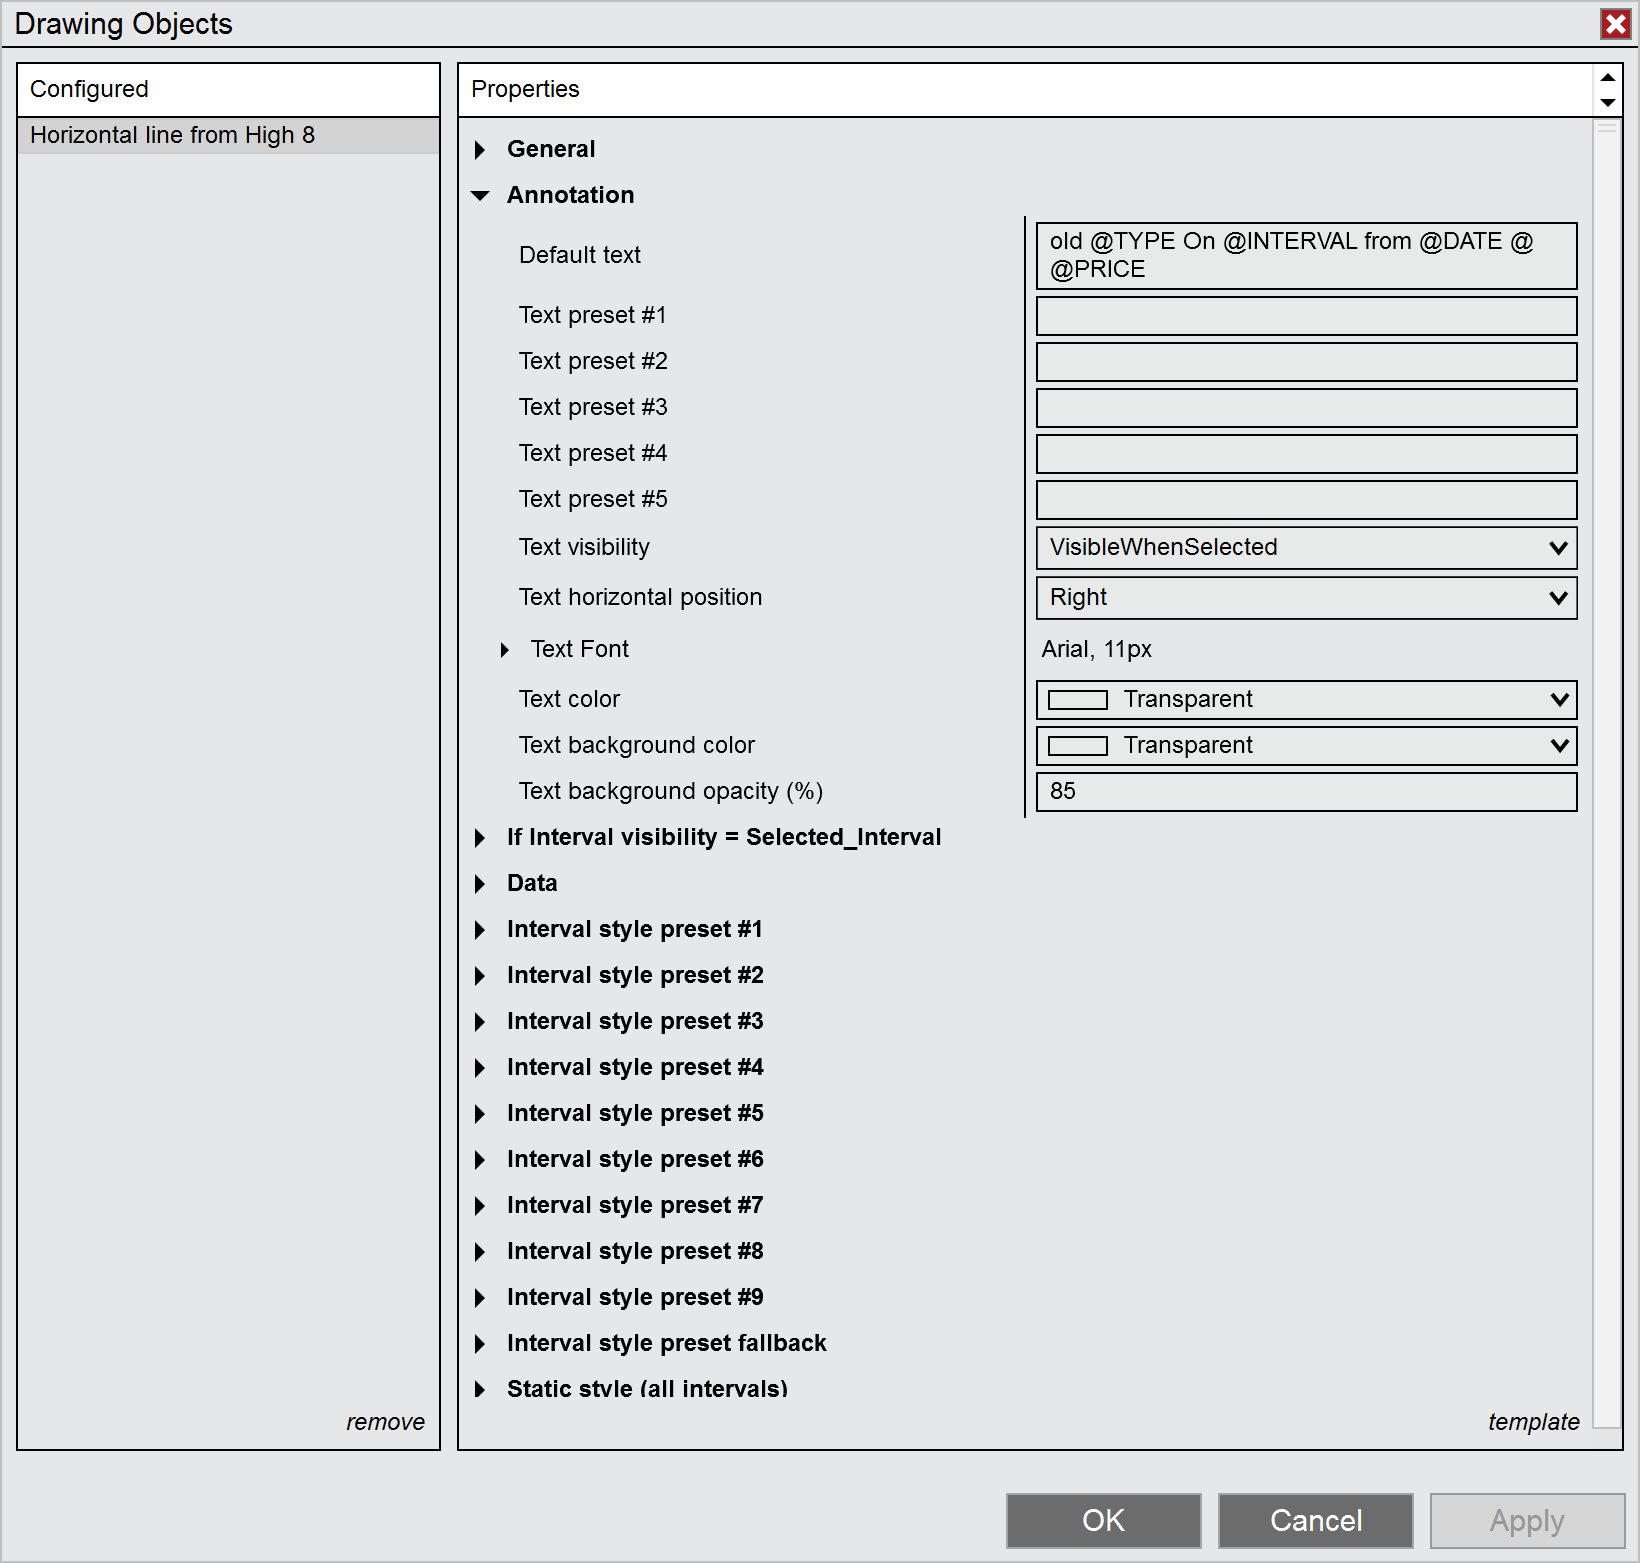
Default text
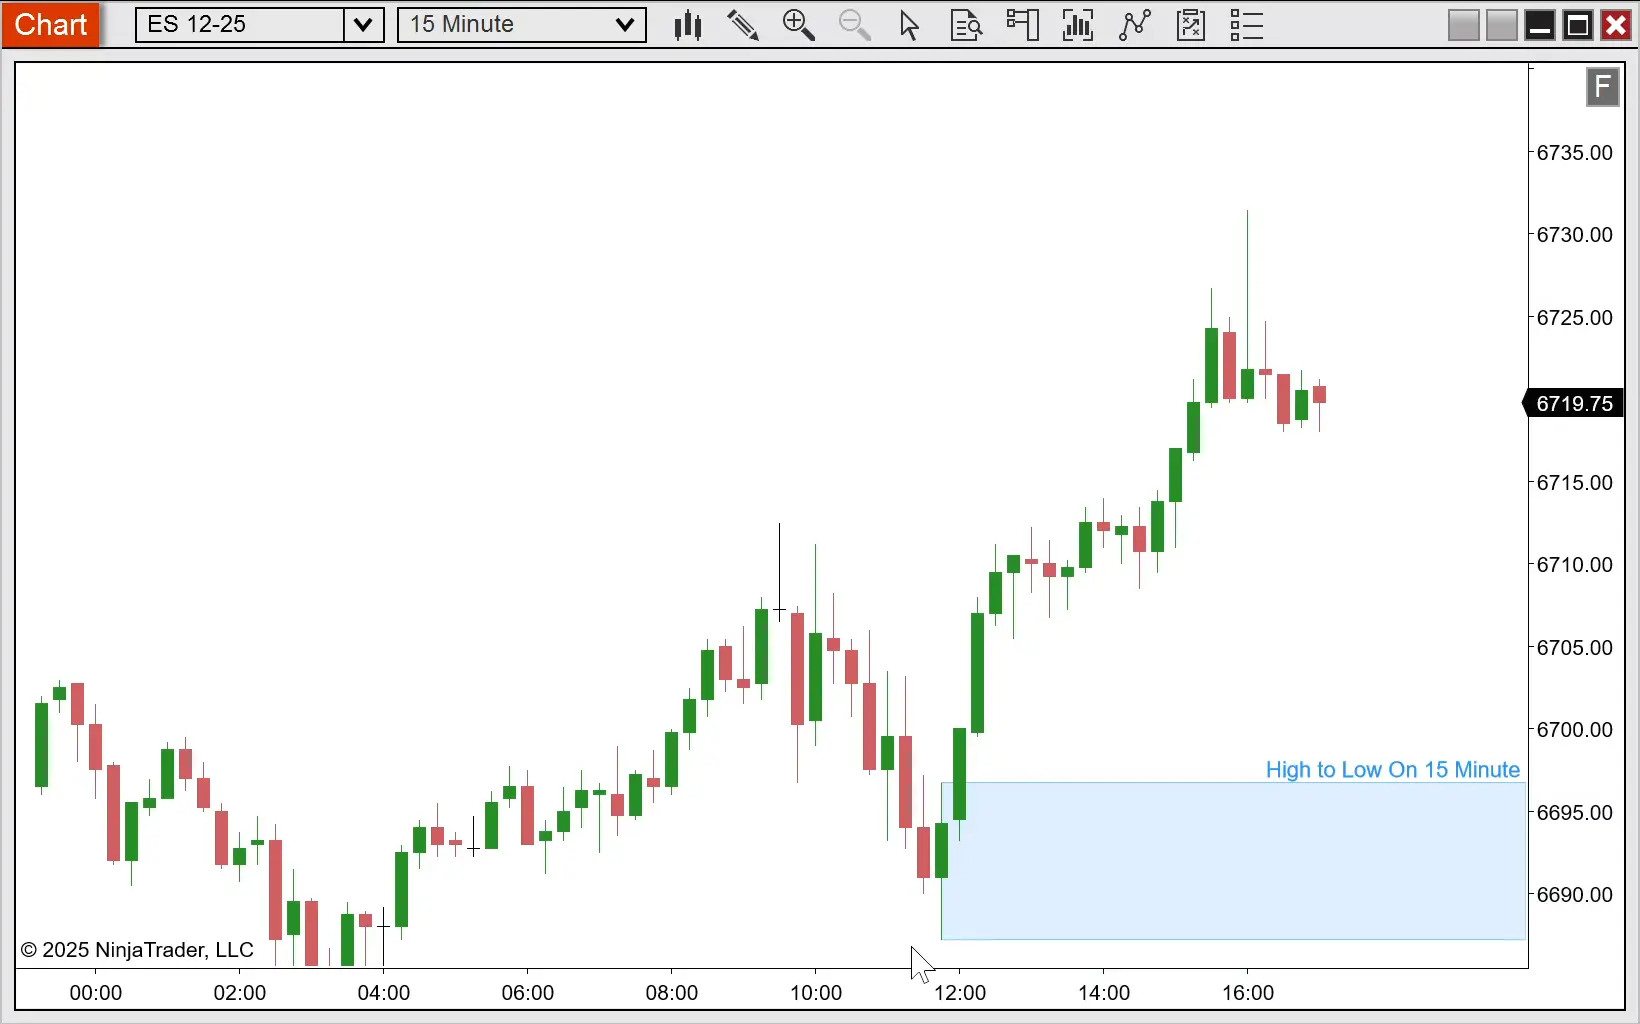
The Default text property defines the automatic annotation text that appears on lines when drawn.
The property is pre-filled with: @TYPE On @INTERVAL from @DATE
Enter any custom text for the annotation. These dynamic placeholders are available to automatically display line details:
- @TYPE – Replaced by the line type (e.g., Gap, Upper Wick, or Candle Body)
- @INTERVAL – Replaced by the chart interval where the line was drawn
- @DATE – Replaced by the date where the line was drawn
- @DATE() – Customizable date format by adding a format specifier inside the parentheses.
- Examples: @DATE(HH:mm) or @DATE(MM/dd) or @DATE(MM/dd HH:mm)
List of available date format specifier to choose from:
| FORMAT SPECIFIER | DESCRIPTION | EXAMPLE |
|---|---|---|
| “d” | The day of the month, from 1 through 31. | 2009-06-01 13:45:30 -> 1 2009-06-15 13:45:30 -> 15 |
| “dd” | The day of the month, from 01 through 31. | 2009-06-01 13:45:30 -> 01 2009-06-15 13:45:30 -> 15 |
| “ddd” | The abbreviated name of the day of the week. | 2009-06-15 13:45:30 -> Mon (en-US) 2009-06-15 13:45:30 -> Пн (ru-RU) 2009-06-15 13:45:30 -> lun. (fr-FR) |
| “dddd” | The full name of the day of the week. | 2009-06-15 13:45:30 -> Monday (en-US) 2009-06-15 13:45:30 -> понедельник (ru-RU) 2009-06-15 13:45:30 -> lundi (fr-FR) |
| “h” | The hour, using a 12-hour clock from 1 to 12. | 2009-06-15 01:45:30 -> 1 2009-06-15 13:45:30 -> 1 |
| “hh” | The hour, using a 12-hour clock from 01 to 12. | 2009-06-15 01:45:30 -> 01 2009-06-15 13:45:30 -> 01 |
| “H” | The hour, using a 24-hour clock from 0 to 23. | 2009-06-15 01:45:30 -> 1 2009-06-15 13:45:30 -> 13 |
| “HH” | The hour, using a 24-hour clock from 00 to 23. | 2009-06-15 01:45:30 -> 01 2009-06-15 13:45:30 -> 13 |
| “m” | The minute, from 0 through 59. | 2009-06-15 01:09:30 -> 9 2009-06-15 13:29:30 -> 29 |
| “mm” | The minute, from 00 through 59. | 2009-06-15 01:09:30 -> 09 2009-06-15 01:45:30 -> 45 |
| “M” | The month, from 1 through 12. | 2009-06-15 13:45:30 -> 6 |
| “MM” | The month, from 01 through 12. | 2009-06-15 13:45:30 -> 06 |
| “MMM” | The abbreviated name of the month. | 2009-06-15 13:45:30 -> Jun (en-US) 2009-06-15 13:45:30 -> juin (fr-FR) 2009-06-15 13:45:30 -> Jun (zu-ZA) |
| “MMMM” | The full name of the month. | 2009-06-15 13:45:30 -> June (en-US) 2009-06-15 13:45:30 -> juni (da-DK) 2009-06-15 13:45:30 -> uJuni (zu-ZA) |
| “s” | The second, from 0 through 59. | 2009-06-15 13:45:09 -> 9 |
| “ss” | The second, from 00 through 59. | 2009-06-15 13:45:09 -> 09 |
| “t” | The first character of the AM/PM designator. | 2009-06-15 13:45:30 -> P (en-US) 2009-06-15 13:45:30 -> 午 (ja-JP) 2009-06-15 13:45:30 -> (fr-FR) |
| “tt” | The AM/PM designator. | 2009-06-15 13:45:30 -> PM (en-US) 2009-06-15 13:45:30 -> 午後 (ja-JP) 2009-06-15 13:45:30 -> (fr-FR) |
| “yy” | The year, from 00 to 99. | 0001-01-01 00:00:00 -> 01 0900-01-01 00:00:00 -> 00 1900-01-01 00:00:00 -> 00 2019-06-15 13:45:30 -> 19 |
| “yyy” | The year, with a minimum of three digits. | 0001-01-01 00:00:00 -> 001 0900-01-01 00:00:00 -> 900 1900-01-01 00:00:00 -> 1900 2009-06-15 13:45:30 -> 2009 |
| “yyyy” | The year as a four-digit number. | 0001-01-01 00:00:00 -> 0001 0900-01-01 00:00:00 -> 0900 1900-01-01 00:00:00 -> 1900 2009-06-15 13:45:30 -> 2009 |
| “yyyyy” | The year as a five-digit number. | 0001-01-01 00:00:00 -> 00001 2009-06-15 13:45:30 -> 02009 |
| “:” | The time separator. | 2009-06-15 13:45:30 -> : (en-US) 2009-06-15 13:45:30 -> . (it-IT) 2009-06-15 13:45:30 -> : (ja-JP) |
| “/” | The date separator. | 2009-06-15 13:45:30 -> / (en-US) 2009-06-15 13:45:30 -> – (ar-DZ) 2009-06-15 13:45:30 -> . (tr-TR) |
Text preset #1 to #5
Up to 5 custom text annotations can be predefined in these properties. When saved as the Default Template, these presets are available from the right-click context menu to quickly change the annotation text without opening the drawing properties window.
Text visibility
Specifies when the line’s text annotation is visible. Choose from the following options:
AlwaysVisible
The annotation text is visible at all times.
VisibleWhenSelected
The annotation text appears only when the line is selected, otherwise it remains hidden.
VisibleOnLowerInterval
When the Interval visibility property is set to “All,” the annotation text displays on the chart interval where the line was drawn and all lower intervals. The text is hidden on higher intervals.
DoNotShow
The annotation text is never displayed.
Text horizontal position
Aligns the annotation text horizontally within the line. Available options are: Left, Middle, or Right.
Text font
Configures the font family, size, and style options (bold, italic) for the annotation text.
Text color
Defines the color of the annotation text displayed above the line.
When set to Transparent, the line’s color is automatically used as the text color.
Text background color
Defines the background color displayed behind the annotation text. This creates a filled box behind the text to improve readability against busy chart backgrounds.
When set to Transparent, the chart’s background color is automatically used as the text background color. To achieve a truly transparent background instead, leave this parameter set to Transparent and set Text background opacity to 0%.
Text background opacity (%)
Controls the transparency level of the text background color.
Help
User guide
Displays the URL link to this user guide. Copy and paste the link into your web browser to access the complete user guide and get the most out of this tool — including how to use it effectively and how to configure each available parameter.
Version
Displays the version number of the Extended Line drawing tool. This is a read-only parameter that shows which version of the tool is currently installed.