User guide
Key Levels
Adding the indicator to your chart
You can add the Key Levels indicator to your chart using either of the following methods:
- Right-click on the chart and select Indicators from the context menu
- Click the Indicators icon on the chart title bar
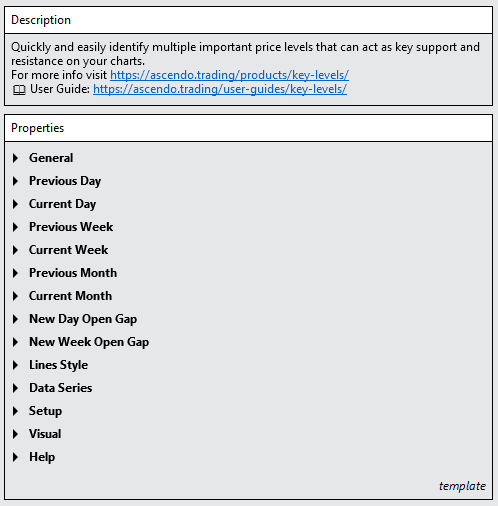
Understanding the tool Properties
The screenshot below shows all available parameters for the Key Levels indicator. Refer to the following sections for detailed explanations of each parameter.
General
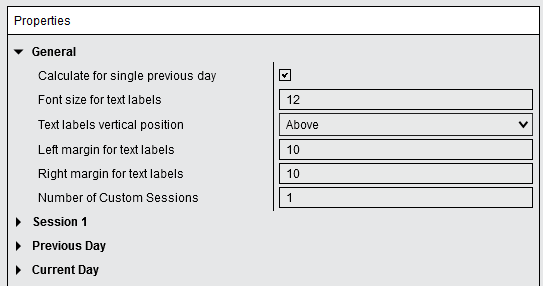
Calculate for single previous day
- Enabled: Key levels are calculated only for the previous day relative to the latest trading day visible on the chart
- Disabled: Key levels are calculated and displayed for all trading days shown on the chart
Font size for text labels
Adjust the font size for all level text labels.
Text labels vertical position
Choose whether text labels appear above or below the level lines.
Left margin for text labels / Right margin for text labels
Adjust the horizontal spacing (in pixels) for text label margins.
Number of Custom Sessions
Specify how many custom intraday sessions to configure (between 0 and 4). Custom sessions allow you to define specific times of day for level calculations.
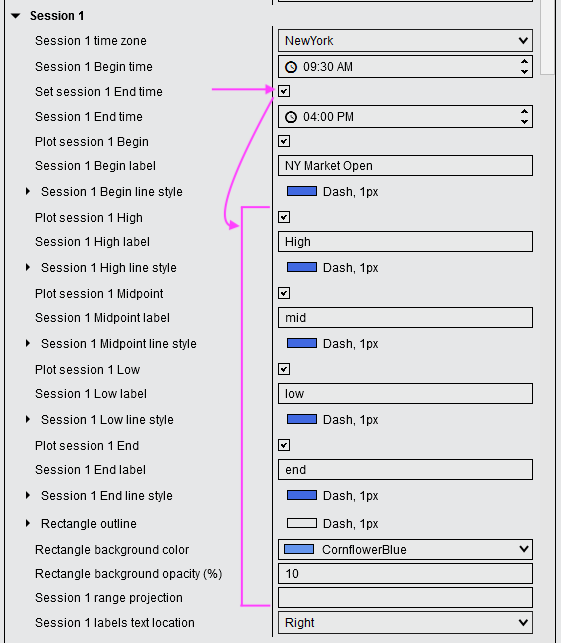
Session 1
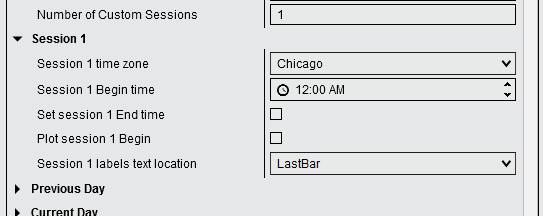
Note: The parameters listed below are explained for the Session 1 section. Each custom session section (Session 2, Session 3, and Session 4) contains the same set of parameters with identical functionality.
Session # time zone
Allows you to specify the time zone for the entered time. Use this feature when you need to reference times in a different time zone than NinjaTrader’s configured time zone.
Example: If NinjaTrader is set to the New York time zone but you want to reference the London Stock Exchange opening time (8:00 AM GMT+0), select “London” for the Session # Time Zone parameter and enter “8:00 AM” for the Session # Begin time. This ensures London times are accurately converted to the chart’s time zone, accounting for any differences in daylight saving time changes between the U.S. and Europe.
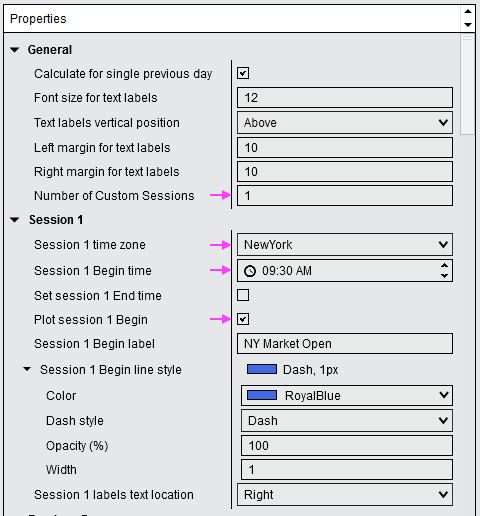
Session # Begin time
A custom session can consist of only a beginning time. For example, to mark the New York Stock Exchange opening price as a level, configure the custom session with the opening time only.
Set session # End time
Allows you to define a time span starting from the Session # Begin Time and ending at the Session # End Time. When activated, additional parameters become visible, allowing you to select which levels should be displayed on the chart.
Labels
For each level, the label parameter enables you to customize the text displayed for that line. You can include the special character @P in the label text, which will be automatically replaced with the price value of that level.
Example: Setting the Session 1 End label to “end” will display “end” on the chart. Using “End @P” will display the label with the actual price value.
Line style
Expand the Line Style parameter to view and modify:
- Color
- Dash style
- Opacity
- Thickness
The Session # labels text location parameter enables you to choose where the label text will be displayed.
Rectangle outline
Expand the Rectangle outline parameter to view and modify the appearance of the rectangle outline:
- Color
- Dash style
- Opacity
- Width
Rectangle background color
Select the background color for the session rectangle.
Rectangle background opacity (%)
Set the transparency level of the rectangle background color. Values range from 0 (fully transparent) to 100 (fully opaque). Lower values allow chart bars and indicators to show through the rectangle background.
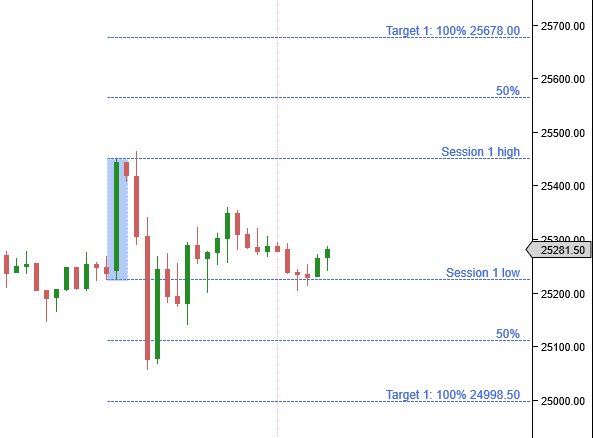
Session # range projection
The Session range projection parameter allows you to create projection lines similar to Fibonacci extension lines. You can input the desired projection percentage values, where:
- 100% represents the full vertical range of the custom session
- 50% represents half of that range
Syntax: Enter percentage values separated by semicolons (;). You can add text before and/or after the number value to create a label. Include the special character @P in the label text to display the price value of that level.
Example: 50; Target 1: 100 @P
Session # labels text location
Select the horizontal alignment of the text labels on the chart. Choose from the following options:
- Left: Labels are aligned to the left of the chart.
- Right: Labels are aligned to the right of the chart.
- Last bar: Labels are aligned to the last bar visible on the chart.
Previous Day
Show Previous Day levels
When you activate the Show Previous Day Levels parameter, the previous day’s values are displayed on the chart. Additional parameters become visible, enabling you to customize which levels to display and adjust the appearance of each level.

Previous Day labels text location
Select the horizontal alignment of the text labels on the chart. Choose from the following options:
- Left: Labels are aligned to the left of the chart.
- Right: Labels are aligned to the right of the chart.
- Last bar: Labels are aligned to the last bar visible on the chart.
Close price from
The Close price from parameter under the Previous Day section enables you to choose between:
- Intraday data: Uses the price from the chart’s intraday bars
- Settlement: Uses the daily settlement price
Intraday data
When you select Intraday data, the indicator uses the prices displayed on the current chart for its calculations. The closing price represents the last traded price at the end of the daily session.
Settlement price
Futures contracts have an official daily settlement price determined by the exchange. The calculation methods for daily closing and settlement prices differ for each contract and are outlined in the contract specifications and the exchange rulebook. These daily settlement prices reflect the fair market value of a commodity or financial instrument based on trades executed during the settlement period, referred to as the “close.”
Example for ES and MES: The daily settlement price for the lead month of the E-Mini S&P 500 (ES) and Micro E-mini S&P 500 (MES) futures is determined by calculating the volume-weighted average price (VWAP) of all trades executed on CME Globex between 14:59:30 and 15:00:00 CT (the settlement period), rounded to the nearest 0.25 index point. For complete details, refer to the CME Group documentation.
When you select Settlement, the indicator uses the open, high, low, and close prices from the daily bar to obtain the settlement close price. Please refer to NinjaTrader Help Guide to understand which data provider offer the settlement adjusted close price for daily bars.
Previous Day … label
For each level, the label parameter (for example Previous Day Open label) allows you to customize the text displayed for that line. You can include the special character @P in the label text, which will be automatically replaced with the price value of that level.
Example: Setting the Previous Day Open label to “pd Open” will display “pd Open” on the chart. Using “pd Open @P” will display the label with the actual price value, such as “pd Open 25150.25”.
Previous Day … line style
Expand the Line Style parameter to view and modify:
- Color
- Dash style
- Opacity
- Width
Show Previous Day Pivot Points
When you activate the Show Previous Day Pivot Points parameter, pivot points calculated from the previous day’s values are displayed on the chart. Additional parameters become visible, allowing you to select which levels to display and adjust the appearance of each level. Refer to the Show Previous Day Levels section above for a description of each parameter.
Previous Day Pivot Points method
Specifies the calculation method used to derive the pivot point levels. Choose from the following options:
- Classic
- Camarilla
- DeMark
- Fibonacci
- Woodie
Additional Level Options
The following sections each contain the same set of parameters as the Previous Day section. Refer to the Previous Day section above for a detailed description of each parameter.
You can show or hide the following levels:
Current Day
- Current Day levels
- Current Day Pivot Points
Previous Week
- Previous Week levels
- Previous Week Pivot Points
Current Week
- Current Week levels
- Current Week Pivot Points
Previous Month
- Previous Month levels
- Previous Month Pivot Points
Current Month
- Current Month levels
- Current Month Pivot Points
New Day Open Gap
Show new day open gap
When you activate the Show New Day Open Gap parameter, the gap between the previous day’s closing price and the current day’s opening price is displayed on the chart.

Calculate gap from
The Calculate gap from parameter defines which price data is used to determine the gap boundaries. Choose between:
- Settlement: Uses the daily settlement close price
- Intraday data: Uses the price from the chart’s intraday bars
Refer to the Close price from section above for more information about the difference between Settlement and Intraday data.
Gap rectangle label
Allows you to customize the text displayed above the rectangle representing the gap.
Rectangle outline
Controls the appearance of the rectangle outline representing the open gap. Expand it to view and modify:
- Color
- Dash style
- Opacity
- Width
Rectangle background color
Select the background color for the gap rectangle.
Rectangle background opacity (%)
Set the transparency level of the rectangle background color. Values range from 0 (fully transparent) to 100 (fully opaque). Lower values allow chart bars and indicators to show through the rectangle background.
Gap Range Projection
Allows you to create projection lines calculated from the vertical range of the new day open gap. Refer to the custom Session range projection parameter under the Session 1 section for syntax and usage instructions, as the same rules apply.
Projection line style
Controls the appearance of the gap range projection lines. Expand it to view and modify:
- Color
- Dash style
- Opacity
- Width
Label text location
Select the horizontal alignment of the text labels on the chart. Choose from the following options:
- Left: Labels are aligned to the left of the chart.
- Right: Labels are aligned to the right of the chart.
- Last bar: Labels are aligned to the last bar visible on the chart.
New Week Open Gap
In the New Week Open Gap section, you can enable the Show New Week Open Gap parameter, which displays the gap between the previous week’s closing price and the current week’s opening price.
This section contains the same set of parameters as the New Day Open Gap section. Refer to the New Day Open Gap section above for a detailed description of each parameter.
Setup
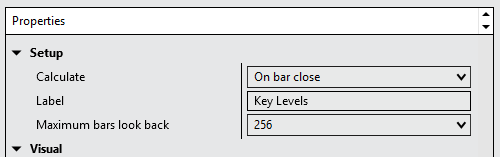
Calculate
Controls when the indicator recalculates its values. Available options are:
- On bar close — The indicator recalculates once per bar, when the bar closes. This is the recommended setting as it minimizes CPU usage but depending on how you configured the parameters of the indicator, On each tick or On price change might be required.
- On each tick — The indicator recalculates on every incoming tick. This increases CPU load and when not required, On Bar close is recommended.
- On price change — The indicator recalculates whenever the price changes.
Performance recommendation: Keep this setting at On bar close to minimize CPU usage.
Label
Sets the name displayed for this indicator instance on the chart and in the Indicators dialog. You can customize this label to distinguish between multiple instances of the indicator when shading several different time zones on the same chart.
Maximum bars look back
Specifies how many historical bars the indicator references. The default value of 256 is sufficient.
Visual

Draw lines in front of chart bars
By default, the key levels are drawn behind of the chart bars. Enable this parameter to draw them in front of the chart bars.
Auto scale
Due to the design of the Key Levels indicator, this property has no effect.
Displacement
This parameter has no effect for this indicator.
Display in Data Box
This parameter has no effect for this indicator.
Panel
Specifies the panel the Key Levels indicator is attached to.
Price marker(s)
This parameter has no effect for this indicator.
Scale justification
It is required to keep this parameter set to Right.
Visible
Controls whether the Key Levels indicator is displayed on the chart. Uncheck this parameter to hide the key level lines without removing the indicator, allowing you to temporarily remove it from view and restore it later.
Help
User guide
Displays the URL link to this user guide. Copy and paste the link into your web browser to access the complete user guide and get the most out of this tool — including how to use it effectively and how to configure each available parameter.
Version
Displays the version number of the Key Levels indicator. This is a read-only parameter that shows which version of the tool is currently installed.