User guide
Price Markers
Accessing the tool
Price Marker is a drawing tool. Access it in one of the following ways:
From the Drawing Tools menu:
- Open the Drawing Tools menu.
- Select Price Marker.
Quick access methods:
- Add the tool to the Drawing Tools Tile indicator for one-click access.
- Assign a hot key for instant activation via keyboard shortcut:
- Open the NinjaTrader Control Center.
- Go to Tools -> Hot keys.
- Assign your preferred key combination.
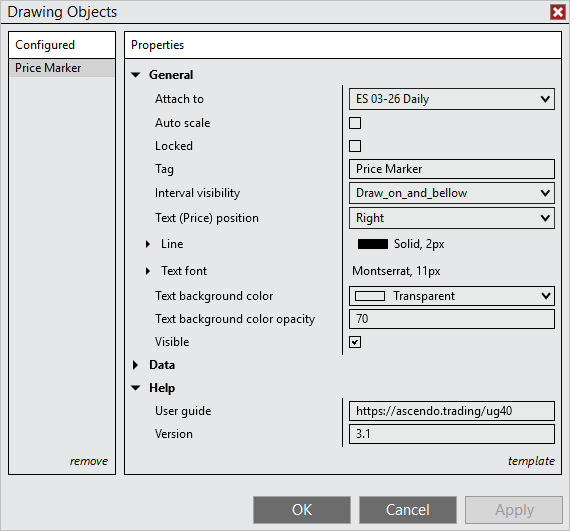
Understanding the tool Properties
The screenshot below shows all available parameters for the Price Marker drawing tool. Refer to the following sections for detailed explanations of each parameter.
General
Attach to
By default, Price Marker drawings are attached only to the chart they were drawn on, making them visible only on that specific chart (local drawing object). This parameter allows you to change the Price Marker to a global drawing object by selecting the instrument name followed by “(All charts)” from the dropdown menu.
Local: The Price Marker is visible only on the specific chart where it was drawn. Local Price Markers are lost when the chart is closed.
Global: The Price Marker is visible on all charts of the same instrument, including any new charts opened for that instrument. Global Price Markers are stored persistently—even if you close all charts of that instrument, the Price Marker will reappear when you open a new chart for the same instrument.
Example: Changing “Attach to” from “MES 03-26 5 Minute” to “MES 03-26 (All charts)” makes the Price Marker visible on all MES 03-26 charts, regardless of the time frame.
Note: Additionally, a Price Marker can be attached to an indicator so that it will be associated with the indicator and its scale.
Auto scale
When enabled, the Price Marker is included to the auto-scaling of the chart so the vertical axis of the chart will be adjusted such that the Price Marker drawing will always be visible.
Locked
Enable this parameter to automatically lock Price Markers after drawing them, preventing accidental repositioning when scrolling your chart. To apply this parameter to all new Price Markers, save it as your Default Template (Template > Save > Save as Default). You can also lock/unlock a drawing by left clicking the drawing to select it, then right clicking the drawing to view the right click menu, then selecting Lock.
Tag
A custom identifier that can be assigned to the Price Marker for organizational purposes or for use with automated trading strategies.
Interval visibility
Controls on which chart intervals the drawing is visible. Choose from the following options:
All
The drawing is visible on all chart intervals.
Draw_on_and_below
The drawing is visible on the chart interval where it was drawn and all lower (shorter) intervals.
Example: Drawing on 60-minute chart makes it visible on 60-minute, 15-minute, 5-minute, etc., but hidden on daily charts. Use this to avoid clutter when viewing higher chart intervals.
Draw_on_and_above
The drawing is visible on the chart interval where it was drawn and all higher (longer) intervals.
Example: A Price Marker drawn on a 60-minute chart is visible on 60-minute, daily, weekly, etc., but hidden on 15-minute charts.
Text (Price) position
Aligns the text (price value) to the left or right of the line.
Line
Configures the line that represents the selected price level. You can set the line color, dash style, opacity and width. Click the expand arrow to access detailed line settings.
Text font
Configures the font family, size, and style options (bold, italic) for the price value text. Click the expand arrow to access detailed font settings.
Text background color
Defines the background color displayed behind the price text. This creates a filled box behind the text to improve readability against busy chart backgrounds.
When set to Transparent, the chart’s background color is automatically used as the text background color. To achieve a truly transparent background instead, leave this parameter set to Transparent and set Text background color opacity to 0%.
Text background color opacity
Controls the transparency level of the text background color. Values range from 0 (fully transparent) to 100 (fully opaque). Lower values allow chart bars and indicators to show through the text background.
Visible
Controls whether the Price Marker drawing is displayed on the chart. Unchecking this parameter hides the Price Marker without deleting it, allowing you to temporarily remove it from the chart view and restore it later.
Help
User guide
Displays the URL link to this user guide. Copy and paste the link into your web browser to access the complete user guide and get the most out of this tool — including how to use it effectively and how to configure each available parameter.
Version
Displays the version number of the Price Marker drawing tool. This is a read-only parameter that shows which version of the tool is currently installed.