User guide
Vertical Grid
Adding the indicator to your chart
You can add the Vertical Grid indicator to your chart using either of the following methods:
- Right-click on the chart and select Indicators from the context menu
- Click the Indicators icon on the chart title bar
Initial setup recommendation
When using the Vertical Grid indicator, it is recommended to deactivate NinjaTrader’s default built-in grid lines to avoid visual overlap and maintain a clean chart display:
- Right-click on your chart and select Properties.
- Go to the Lines section.
- Expand Grid line – vertical.
- Uncheck the Visible setting.
Understanding the tool Properties
The screenshot below shows all available parameters for the Vertical Grid indicator. Refer to the following sections for detailed explanations of each parameter.

Divider Sections

The properties window contains the following divider sections:
- Yearly divider — Highlights the last trading day of each calendar year.
- Quarterly divider — Highlights the last trading day of each quarter.
- Monthly divider — Highlights the last trading day of each month.
- Weekly divider — Highlights the last trading day of each week.
- Daily divider — Highlights the last trading day of each day.
- Hourly divider — Highlights the last trading bar of each hour.
- Minute divider — Displays divider lines at a configurable minute interval.
- Intraday fixed time divider style 1, 2, and 3 — Displays divider lines at specific times of day that you define.
Toggling Divider Visibility
To show or hide the lines for a specific divider type, select or deselect the corresponding checkbox within that divider’s section in the properties window.
Example:
- Deselect the Yearly checkbox under the Yearly divider section to hide yearly divider lines.
- Select the Weekly checkbox under the Weekly divider section to display weekly divider lines.

Customizing Divider Line Style
Each divider type can be styled independently. For each divider, you can configure the following attributes:
- Color
- Dash style
- Opacity (%)
- Width
This allows you to visually differentiate each divider type at a glance. By default, a unique color is assigned to each divider type.
Minimum Pixels
The Minimum pixels setting automatically hides grid lines when the average distance in pixels between lines falls below the specified value. This prevents the chart from becoming cluttered when lines would otherwise be spaced too closely together.
Example: If you set this value to 20, any divider lines with an average spacing of fewer than 20 pixels will be automatically hidden.
Minimum Bars
The Minimum bars setting automatically hides grid lines when the average number of bars between lines falls below the specified value. This helps maintain a clean and readable chart display when the chart is zoomed out.
Example: If you set this value to 5, any divider lines with fewer than 5 bars between them on average will be automatically hidden.
Minute Divider
The Minute divider section includes a setting titled Minute every ?? minutes. Enter the desired interval in this field to control how frequently the minute divider lines are displayed.
Example: To display a divider line every 15 minutes, enter 15 in this field.
Intraday Fixed Time Dividers
The Intraday fixed time divider style 1, 2, and 3 sections each include a List of times setting. Use this setting to specify the exact times of day at which divider lines should appear on your chart.
Time format rules:
- Times must be entered in
HH:mmformat using the 24-hour clock. - To display a line at 1:30 AM, enter
01:30. - To display a line at 3:47 PM, enter
15:47. - To display multiple lines, separate each time with a comma.
Example: To display lines at the market open, 5 minutes later, 15 minutes later, and at the top of the next two hours, enter:
09:30, 09:35, 09:45, 10:00, 10:30
Having three independent intraday fixed time divider styles allows you to apply different line styles to different groups of fixed times. For example, you could use style 1 with a bold red line for market open and close times, and style 2 with a subtle dashed line for intermediate time references.
Zoom levels preset

The Zoom levels preset section allows you to define up to 5 preset zoom levels. Each zoom level is defined by two values:
- Bar width — Controls the width of each bar. Note that this value is not expressed in pixels.
- Bar spacing — Represents the distance in pixels between the left edge of one bar and the left edge of the adjacent bar. The minimum value is 1.
Finding the current bar width and spacing values
If you are unsure which values to enter, check the Print the bar width and spacing values checkbox. Then open the NinjaScript Output window from the New menu in the NinjaTrader Control Center to view the current values for your chart.
Adjusting the zoom level manually:
You can adjust the zoom level of a chart using any of the following methods:
- Click the Chart Style icon and use the Bar Spacing +/- and Bar Width +/- controls.
- Left-click in the x-axis margin and drag the cursor left or right.
- Use the keyboard shortcuts CTRL + Up and CTRL + Down.
Applying a preset zoom level
Once your preferred zoom levels are defined, right-click on the chart and select the desired zoom preset from the context menu.
Important: The zoom preset feature is only available on charts configured with Equidistant bar spacing. To enable this setting, right-click on your chart, select Properties, go to the General section, and check the Equidistant bar spacing option.
Toggle Time Button
After adding the Vertical Grid indicator to your chart, a button labeled Toggle Time will appear on the chart title bar. Clicking this button toggles the display of time information in the lower right corner of the chart.
The time information displayed includes:
- Line 1 — The current time.
- Line 2 — The date and time of the first and last visible bars on the chart.
This feature is particularly useful when capturing chart screenshots for your trading journal, as it provides an accurate time reference embedded directly in the chart view.
Setup

Calculate
Controls when the indicator recalculates its values. Available options are:
- On bar close — The indicator recalculates once per bar, when the bar closes. This is the recommended setting as it minimizes CPU usage.
- On each tick — The indicator recalculates on every incoming tick. This increases CPU load and is generally not necessary for a session shading indicator.
- On price change — The indicator recalculates whenever the price changes.
Performance recommendation: Keep this setting at On bar close to minimize CPU usage.
Label
Sets the name displayed for this indicator instance on the chart and in the Indicators dialog. You can customize this label to distinguish between multiple instances of the indicator when shading several different time zones on the same chart.
Maximum bars look back
Specifies how many historical bars the indicator references. The default value of 256 is sufficient.
Visual
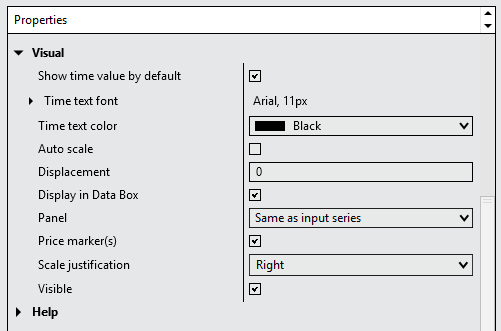
Show time value by default
When this parameter is active, time information is displayed in the lower right corner of the chart when loading a new chart or when loading/refreshing the indicator.
When this parameter is inactive, time information is hidden by default. To display the time, use the toggle button in the chart title bar.
Time text font
Configures the font family, size, and style options (bold, italic) of the time information text displayed in the lower right corner of the chart when the Toggle Time feature is active. See the Toggle Time Button section below for more details.
Time text color
Configures the color of the time information text displayed in the lower right corner of the chart when the Toggle Time feature is active. See the Toggle Time Button section below for more details.
Auto scale
Due to the design of the Vertical Grid indicator, this property has no effect. The divider lines covers the full vertical space of the chart, including any additional panels.
Displacement
This parameter has no effect for this indicator.
Display in Data Box
This parameter has no effect for this indicator.
Panel
Specifies the panel the Vertical Grid indicator is attached to. This parameter has no functional effect — by design, the dividers lines always extends across the full vertical range of the chart, regardless of which panel is selected.
Price marker(s)
This parameter has no effect for this indicator.
Scale justification
This parameter has no effect for this indicator.
Visible
Controls whether the Vertical Grid indicator is displayed on the chart. Uncheck this parameter to hide the time divider lines without removing the indicator, allowing you to temporarily remove it from view and restore it later.
Help
User guide
Displays the URL link to this user guide. Copy and paste the link into your web browser to access the complete user guide and get the most out of this tool — including how to use it effectively and how to configure each available parameter.
Version
Displays the version number of the Vertical Grid indicator. This is a read-only parameter that shows which version of the tool is currently installed.