User guide
VWAP
Overview
The VWAP product includes the following indicators, all available once the product is installed:
- VWAP — A versatile indicator that lets you choose the reset interval from within its properties. Use this indicator when you want a single instance that you can reconfigure on the fly.
- VWAP Daily — VWAP preset to reset every session.
- VWAP Weekly — VWAP preset to reset every week.
- VWAP Monthly — VWAP preset to reset every month.
- VWAP Quarterly — VWAP preset to reset every quarter.
- VWAP Yearly — VWAP preset to reset every year.
All six indicators share identical settings, with one difference: the interval-specific indicators (VWAP Daily through VWAP Yearly) do not expose a Reset interval parameter because their interval is fixed by design.
The main advantage of the interval-specific indicators is that each one can carry its own saved default template. For example, you can configure VWAP Daily with a blue line and three standard deviation bands, and configure VWAP Weekly with an orange line and one band, then save each as its own default template. Loading both indicators onto a chart instantly applies the correct appearance for each timeframe without any manual adjustment. This makes it significantly faster to set up a chart exactly the way you want it.
This user guide covers all settings. Wherever the Reset interval parameter is referenced, note that it applies only to the versatile VWAP indicator and is not present in the interval-specific variants.
Adding the indicator to your chart
You can add the VWAP indicator to your chart using either of the following methods:
- Right-click on the chart and select Indicators from the context menu.
- Click the Indicators icon on the chart title bar.
Understanding the Properties
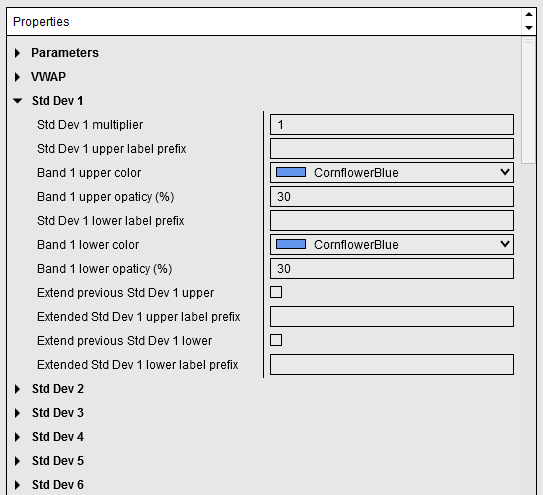
The screenshot below shows all available parameters for the VWAP indicator. Refer to the following sections for detailed explanations of each parameter.

The properties are organized into the following sections: Parameters, VWAP, and one section per active standard deviation band (Std Dev 1 through Std Dev 9).
Parameters

Reset interval
Defines the time interval over which the VWAP and standard deviation bands are calculated and reset. Select from the following options:
- Session — The VWAP resets at the beginning of each trading session.
- Week — The VWAP resets at the beginning of each calendar week.
- Month — The VWAP resets at the beginning of each calendar month.
- Quarter — The VWAP resets at the beginning of each calendar quarter.
- Year — The VWAP resets at the beginning of each calendar year.
Std Dev bands
Controls how many standard deviation band pairs are displayed on the chart. Each band pair consists of one upper band and one lower band plotted symmetrically around the VWAP line. Select from the following options: None, One, Two, Three, Four, Five, Six, Seven, Eight, or Nine.
Setting this parameter to None displays only the VWAP line with no bands.
Note: Each enabled band pair adds two plots to the chart (upper and lower). Enabling a large number of bands may affect chart readability. It is recommended to configure colors and opacity to visually differentiate each band.
Show prefix labels in right margin
When enabled, a prefix label is displayed in the right margin of the chart next to each plotted line. The text of each prefix is configured individually in the VWAP and Std Dev band sections.
Show price labels in right margin
When enabled, the price value of each plotted line is displayed in the right margin of the chart alongside the prefix label.
Font size for labels in right margin
Defines the font size, in points, for all prefix and price labels displayed in the right margin. The accepted range is 1 to 100.
VWAP
VWAP label prefix
The text displayed in the right margin next to the VWAP line when Show prefix labels in right margin is enabled.
Example: Enter VWAP to label the line as VWAP in the right margin.
Plot VWAP extension
When enabled, the VWAP value from the end of the previous reset interval is extended as a horizontal line into the current interval. This allows you to see where the prior interval’s VWAP is relative to the current price.
VWAP extension label prefix
The text displayed in the right margin next to the VWAP extension line when Show prefix labels in right margin is enabled.
Example: Enter pVWAP to label the extension line as pVWAP in the right margin.
Standard Deviation Bands (Std Dev 1–9)
The properties described in this section apply identically to each standard deviation band (Std Dev 1 through Std Dev 9). The number of visible band sections is determined by the Std Dev bands parameter in the Parameters section. Each band section controls the appearance and behavior of one upper/lower band pair plotted around the VWAP.
Std Dev multiplier
The multiplier applied to the standard deviation to determine the distance of the band from the VWAP line. A higher value places the band further from the VWAP.
Example: A multiplier of 1.0 plots the band at one standard deviation from the VWAP. A multiplier of 2.0 plots the band at two standard deviations.
Std Dev upper label prefix
The text displayed in the right margin next to the upper band line when Show prefix labels in right margin is enabled.
Example: Enter +1σ to label the first upper band accordingly in the right margin.
Band upper color
The color of the upper band line. Click the color swatch to open the color picker and select your preferred color.
Band upper opacity (%)
The opacity of the upper band line, expressed as a percentage. The accepted range is 0 (fully transparent) to 100 (fully opaque). Lower values make the line more transparent, allowing underlying chart elements to show through.
Std Dev lower label prefix
The text displayed in the right margin next to the lower band line when Show prefix labels in right margin is enabled.
Example: Enter -1σ to label the first lower band accordingly in the right margin.
Band lower color
The color of the lower band line. Click the color swatch to open the color picker and select your preferred color.
Band lower opacity (%)
The opacity of the lower band line, expressed as a percentage. The accepted range is 0 (fully transparent) to 100 (fully opaque).
Extend previous Std Dev upper
When enabled, the upper band value from the end of the previous reset interval is extended as a horizontal line into the current interval. This mirrors the Plot VWAP extension behavior but for the upper standard deviation band.
Extended Std Dev upper label prefix
The text displayed in the right margin next to the extended upper band line when Show prefix labels in right margin is enabled.
Extend previous Std Dev lower
When enabled, the lower band value from the end of the previous reset interval is extended as a horizontal line into the current interval.
Extended Std Dev lower label prefix
The text displayed in the right margin next to the extended lower band line when Show prefix labels in right margin is enabled.
Performance recommendation
To minimize CPU usage, it is recommended to keep the Calculate setting, located under the Setup section of the indicator properties, set to On bar close. This is the default setting and ensures the indicator recalculates only when a new bar closes rather than on every tick. Enabling a large number of standard deviation bands on a high-frequency chart may increase processing load; using On bar close mitigates this.
Visual
Auto scale
When enabled, the VWAP levels are included to the auto-scaling of the chart so the vertical axis of the chart will be adjusted such that the VWAP lines and bands will always be visible.
Displacement
Sets the number of bars by which to displace the indicator plots.
Panel
Sets the panel in which the VWAP is plotted. If you select “Same as input series,” the VWAP will be linked to the Input Series and automatically move if the Input Series is modified to a different panel.
Price marker(s)
When enabled, the indicator value is plotted in the axis selected under the “Scale Justification” property.
Scale justification
Sets the scale on which the indicator will be plotted. Possible values are “Right,” “Left,” and “Overlay”
Visible
Show or hide of the VWAP indicator on the chart.
Help
User guide
Displays the URL link to this user guide. Copy and paste the link into your web browser to access the complete user guide and get the most out of this tool — including how to use it effectively and how to configure each available parameter.
Version
Displays the version number of the VWAP indicator. This is a read-only parameter that shows which version of the tool is currently installed.
Plots
The Plots section controls the visual appearance of every line rendered by the indicator. Each plotted line — the VWAP, the VWAP extension, and each standard deviation band upper line, upper extension line, lower line, and lower extension line — exposes the following four properties. Click the expand arrow next to a plot name to access its individual settings.

Color
The color of the plotted line. Click the color swatch to open the color picker and select your preferred color.
Dash style
The dash pattern used to draw the line. Available options include Solid, Dot, Dash, DashDot, and DashDotDot.
Plot style
The rendering style of the line. Available options include Line, Bar, Hash, and others supported by NinjaTrader 8. The default value is Line.
Width
The thickness of the plotted line, in pixels. Enter a positive integer value. A value of 1 renders a single-pixel line; higher values produce thicker lines.
Note: The Plots section contains one entry for each active line: VWAP, VWAP extension, and for each enabled standard deviation band, Std Dev n upper, Std Dev n upper extension, Std Dev n lower, and Std Dev n lower extension. The number of entries therefore depends on the values set in the Std Dev bands and the individual Extend previous Std Dev parameters. For bands where the extension is not enabled, the corresponding extension plot entry is still present in the Plots section but has no visible effect on the chart.