
User guide
News Events
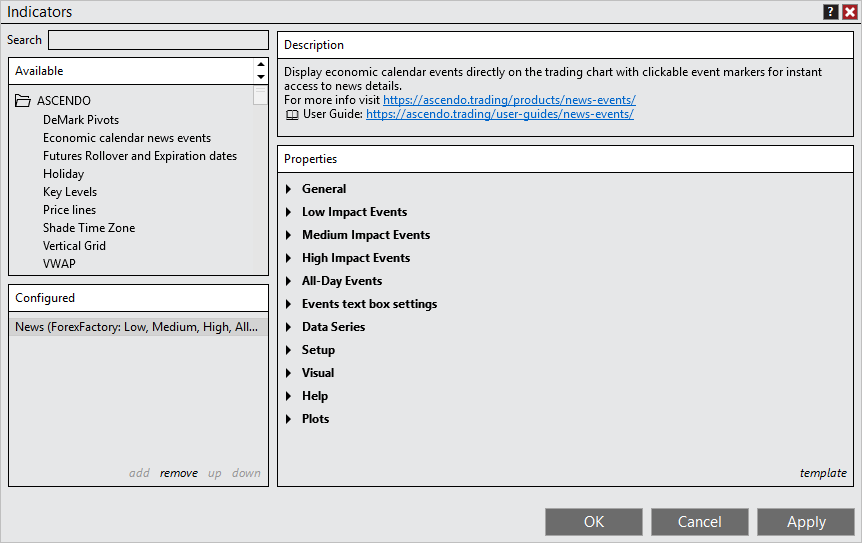
Adding the indicator to your chart
You can add the Shade Time Zone indicator to your chart using either of the following methods:
- Right-click on the chart and select Indicators from the context menu.
- Click the Indicators icon on the chart title bar.
- Under the ASCENDO folder, select Economic calendar news events.
Understanding the Properties
The screenshot below shows all available parameters for the Economic calendar news events indicator.
General
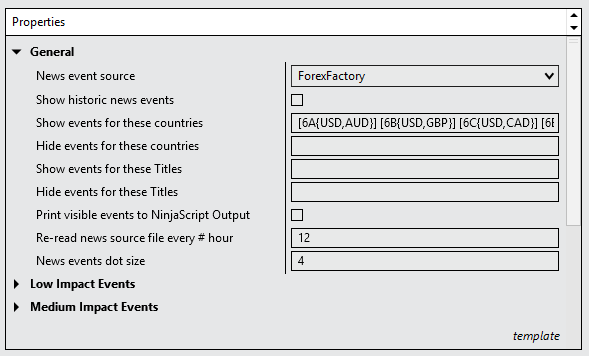
News event source
ForexFactory: When selected, the news events are automatically downloaded from the Forex Factory website.
Myfxbook: When selected, the news event source file must be manually downloaded from the Myfxbook website by following these instructions.
Show historic news events
Displays news events older than the current week when enabled. When disabled, only current week events are shown.
Note: Myfxbook requires manual creation of the historical news events file.
Show events for these countries
Controls which countries’ news events are displayed on the chart. By default, events matching the instrument’s currency are displayed.
Syntax:
To customize which news events to display, use the following format:
[INSTRUMENTS {Country codes}]Instruments: List instrument symbols separated by commas inside square brackets[ ]Country codes: List country codes separated by commas inside curly braces{ }. Use the codes shown in the “Currency” column on the Forex Factory Calendar webpage.- “
ALL” keyword: Applies rule to all instruments or all countries
Examples:
Display US and Canadian news for ES, MES, NQ, and MNQ contracts:
[ES, MES, NQ, MNQ {USD, CAD}]Display news from all countries for all instruments:
[ALL {ALL}]Default configuration:
The indicator includes pre-configured rules for major currency futures contracts to show news from the United States and the paired currency’s country:
[6A{USD,AUD}] [6B{USD,GBP}] [6C{USD,CAD}] [6E{USD,EUR}] [6J{USD,JPY}] [6N{USD,NZD}] [6S{USD,CHF}]Hide events for these countries
Hides news events from specific countries on the chart. By default, events matching the instrument’s currency are displayed.
How to determine an instrument’s currency:
From the NinjaTrader Control Center, navigate to Tools → Instruments, locate the instrument, then click edit. The instrument currency is displayed in the General section under the Currency property.
Syntax:
To customize which news events to hide, use the following format:
[INSTRUMENTS {Country codes}]Instruments: List instrument symbols separated by commas inside square brackets[ ]Country codes: List country codes separated by commas inside curly braces{ }. Use the codes shown in the “Currency” column on the Forex Factory Calendar webpage.- “
ALL” keyword: Applies rule to all instruments or all countries
Examples:
Hide US news for the 6A contract:
[6A {USD}]Hide all news for all instruments:
[ALL {ALL}]Countries show / hide order
Determines the order in which show and hide rules are applied when both “Show events for these countries” and “Hide events for these countries” contain rules.
Available options:
- Show first, Hide after: Show rules are applied first, then hide rules
- Hide first, Show after: Hide rules are applied first, then show rules
Example:
If rules are configured to both show and hide Canadian news for the ES contract:
- Show first, Hide after: Canadian news will NOT appear (hide rule takes priority)
- Hide first, Show after: Canadian news WILL appear (show rule takes priority)
Tip: Enable the “Print all news events visible on the chart to NinjaScript Output” property to verify which news events are displayed on the chart. To view the output, navigate to New → NinjaScript Output from the NinjaTrader Control Center. Select the NinjaScript Output window to view the news events list and confirm that the configured rules are producing the expected results.
Show events for these Titles
Controls which news events are displayed on the chart based on title keywords. News events containing any of the specified keywords in their titles will be shown, regardless of country or instrument currency.
Syntax:
To customize which news events to display by title, use the following format:
[INSTRUMENTS {Title keywords}]Instruments: List instrument symbols separated by commas inside square brackets[ ]Title keywords: List keywords separated by commas inside curly braces{ }. Events containing any of these keywords in their title will be displayed.
Examples:
Display news with titles containing “German” or “CPI m/m” for ES and MES contracts:
[ES, MES {German, CPI m/m}]Result: All news titles containing either “German” or “CPI m/m” appear on the chart, regardless of country. This includes:
- “German Prelim CPI m/m”
- “French Prelim CPI m/m”
- “German Import Prices m/m”
- Any other titles containing “German” or “CPI m/m”
Hide events for these Titles
Hides news events from the chart based on title keywords. Events containing any of the specified keywords in their titles will be hidden, regardless of country or instrument currency.
Syntax:
To customize which news events to hide by title, use the following format:
[INSTRUMENTS {Title keywords}]Instruments: List instrument symbols separated by commas inside square brackets[ ]Title keywords: List keywords separated by commas inside curly braces{ }. Events containing any of these keywords in their title will be hidden.
Examples:
Hide news with titles containing “Wards Total Vehicle Sales” or “CPI m/m” for ES and MES contracts:
[ES, MES {Wards Total Vehicle Sales, CPI m/m}]Note: Title filtering is processed after country filtering. Country rules are applied first, then title rules.
Titles show / hide order
Determines the order in which show and hide rules are applied when both “Show events for these Titles” and “Hide events for these Titles” contain rules.
Available options:
- Show first, Hide after: Show rules are applied first, then hide rules
- Hide first, Show after: Hide rules are applied first, then show rules
Example:
If rules are configured to show titles containing “FOMC Statement” and hide titles containing “FOMC” for the ES contract:
- Show first, Hide after: No FOMC news will appear, including “FOMC Statement” (hide rule takes priority and removes all titles containing “FOMC”)
- Hide first, Show after: Only “FOMC Statement” will appear (show rule takes priority). Other FOMC news such as “FOMC Press Conference” and “FOMC Economic Projections” will be hidden.
Tip: Enable the “Print all news events visible on the chart to NinjaScript Output” property to verify which news events are displayed on the chart. To view the output, navigate to New → NinjaScript Output from the NinjaTrader Control Center. Select the NinjaScript Output window to view the news events list and confirm that the configured rules are producing the expected results.
Print visible events to NinjaScript Output
When enabled, all news events visible on the chart are printed to the NinjaScript Output window. This setting is useful for:
- Verifying that filter rules are working as expected
- Retrieving all dates for specific news events when using filter settings
- Debugging display issues
To view the output: from the NinjaTrader Control Center navigate to New → NinjaScript Output. Select the NinjaScript Output window to view the news events list.
Re-read news source file every # hour
Specifies the interval (in hours) for automatically re-reading the news events source file.
Note: The news events source file is automatically re-read when the chart instrument or interval is changed. This setting ensures the file is refreshed even when charts remain unchanged for extended periods.
News events dot size
Sets the dot diameter in pixels for news event markers displayed at the bottom of the chart window.
News impact events sections
Each news impact level (Low, Medium, High) has its own configuration section with identical parameters. The following descriptions reference Low impact events, but the same parameters apply to Medium and High impact levels.
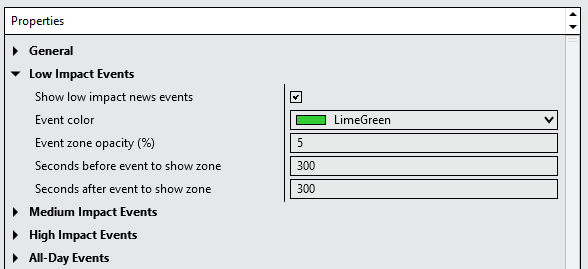
Show low impact news events
Controls visibility of low impact news events on the chart.
Event color
Sets the color for the low impact events band and news event dot.
Event zone opacity (%)
Controls the transparency level of the news event band (0-100%).
Seconds before event to show zone
Duration in seconds before the news release time when the colored band becomes visible.
Seconds after event to show zone
Duration in minutes after the news release time when the colored band remains visible.
Events text box
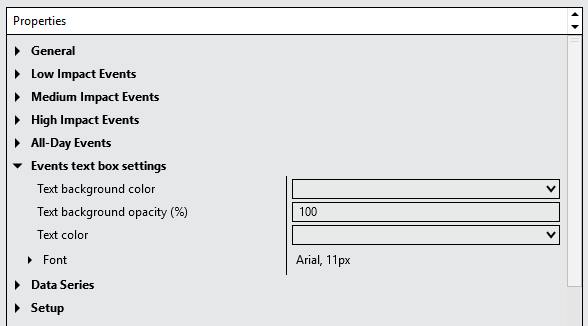
Text background color
Background color for the news description text box.
Default: Uses the chart window’s background color automatically. Set a custom color to override the default.
Text background opacity (%)
Controls the transparency level of the news description text box background (0-100%).
Text color
Text color for the news description.
Default: Uses the chart window’s text color automatically. Set a custom color to override the default.
Font
Font family and size for the news description text.
Setup
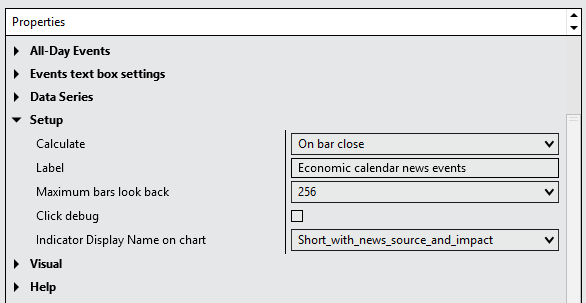
Calculate
Controls when the indicator recalculates its values. Available options are:
- On bar close — The indicator recalculates once per bar, when the bar closes. This is the recommended setting as it minimizes CPU usage.
- On each tick — The indicator recalculates on every incoming tick. This increases CPU load and is generally not necessary for a session shading indicator.
- On price change — The indicator recalculates whenever the price changes.
Performance recommendation: Keep this setting at On bar close to minimize CPU usage.
Label
Sets the name displayed for this indicator instance on the chart and in the Indicators dialog. You can customize this label to distinguish between multiple instances of the indicator when shading several different time zones on the same chart.
Maximum bars look back
Specifies how many historical bars the indicator references. In most cases, the default value of 256 is sufficient.
Click debug
Troubleshooting tool for news description box click issues.
To use it:
- Enable the Click debug property in the Setup section
- Open the NinjaScript Output window (NT Control Center → New → NinjaScript Output)
- Position both the chart and Output window to be visible simultaneously
- A black dot appears on the chart at midnight of the current day
- Click the black dot to view drawn coordinates versus actual click coordinates in the Output window
If issues persist: Capture a screenshot showing the chart, black dot, and Output window. Send the screenshot via email for investigation. See this video for detailed instructions.
Indicator Display Name on chart
Controls the name displayed at the top left corner of the chart for this indicator. When multiple indicators are loaded on the same chart, each indicator name appears in the chart header and can cause visual clutter. This parameter allows you to shorten or customize the displayed name to keep the chart header clean and readable.
Select from the following options:
Default The full default NinjaTrader indicator name is displayed. This includes the instrument name and the bar period.
Example: Economic calendar news events (MES 12-25 (5 Minute))
Short A compact version of the indicator name is displayed, with no additional detail.
Example: News
Short_with_news_source A compact name is displayed, including the configured news source.
Example: News (ForexFactory) or News (Myfxbook)
Short_with_news_source_and_impact A compact name is displayed, including the configured news source and all enabled impact levels.
Example: News (ForexFactory: Medium, High)
Only the impact levels that are currently enabled (Low, Medium, High, All-day) are included in the displayed name. If multiple impact levels are enabled, they appear as a comma-separated list.
Tip: To keep the chart header uncluttered when running multiple indicators, use the Short or Short_with_news_source option. Use Short_with_news_source_and_impact when you need a quick visual reminder of which news impact levels are active without opening the indicator properties.
Visual
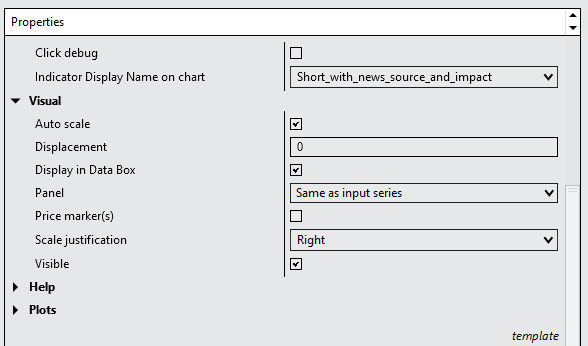
Auto scale
Due to the design of the Economic calendar news events indicator, this property has no effect. The news events bands covers the full vertical space of the chart, including any additional panels.
Displacement
This parameter has no effect for this indicator.
Panel
Specifies the panel the Economic calendar news events indicator is attached to. This parameter has no functional effect — by design, the news events bands always extends across the full vertical range of the chart, regardless of which panel is selected.
Price marker(s)
This parameter has no effect for this indicator.
Scale justification
This parameter has no effect for this indicator.
Visible
Controls whether the Economic calendar news events indicator is displayed on the chart. Uncheck this parameter to hide the news events without removing the indicator, allowing you to temporarily remove it from view and restore it later.
Help
User guide
Displays the URL link to this user guide. Copy and paste the link into your web browser to access the complete user guide and get the most out of this tool — including how to use it effectively and how to configure each available parameter.
Version
Displays the version number of the Economic calendar news events indicator. This is a read-only parameter that shows which version of the tool is currently installed.