Never miss critical price levels again
Stop wasting time manually marking up your charts every day. Key Levels automatically plots the price levels that matter most—so you can focus on trading, not chart preparation.
Why traders choose Key Levels
Every serious trader knows that previous highs, lows, and pivot points often act as support and resistance. But manually drawing these levels wastes valuable time and risks human error.
Key Levels does the work for you—instantly displaying the critical price levels from previous sessions, right when you need them.
The result? Faster analysis. Better-prepared entries and exits. More time to focus on your trading edge.
What you get
Instantly track levels from multiple timeframes
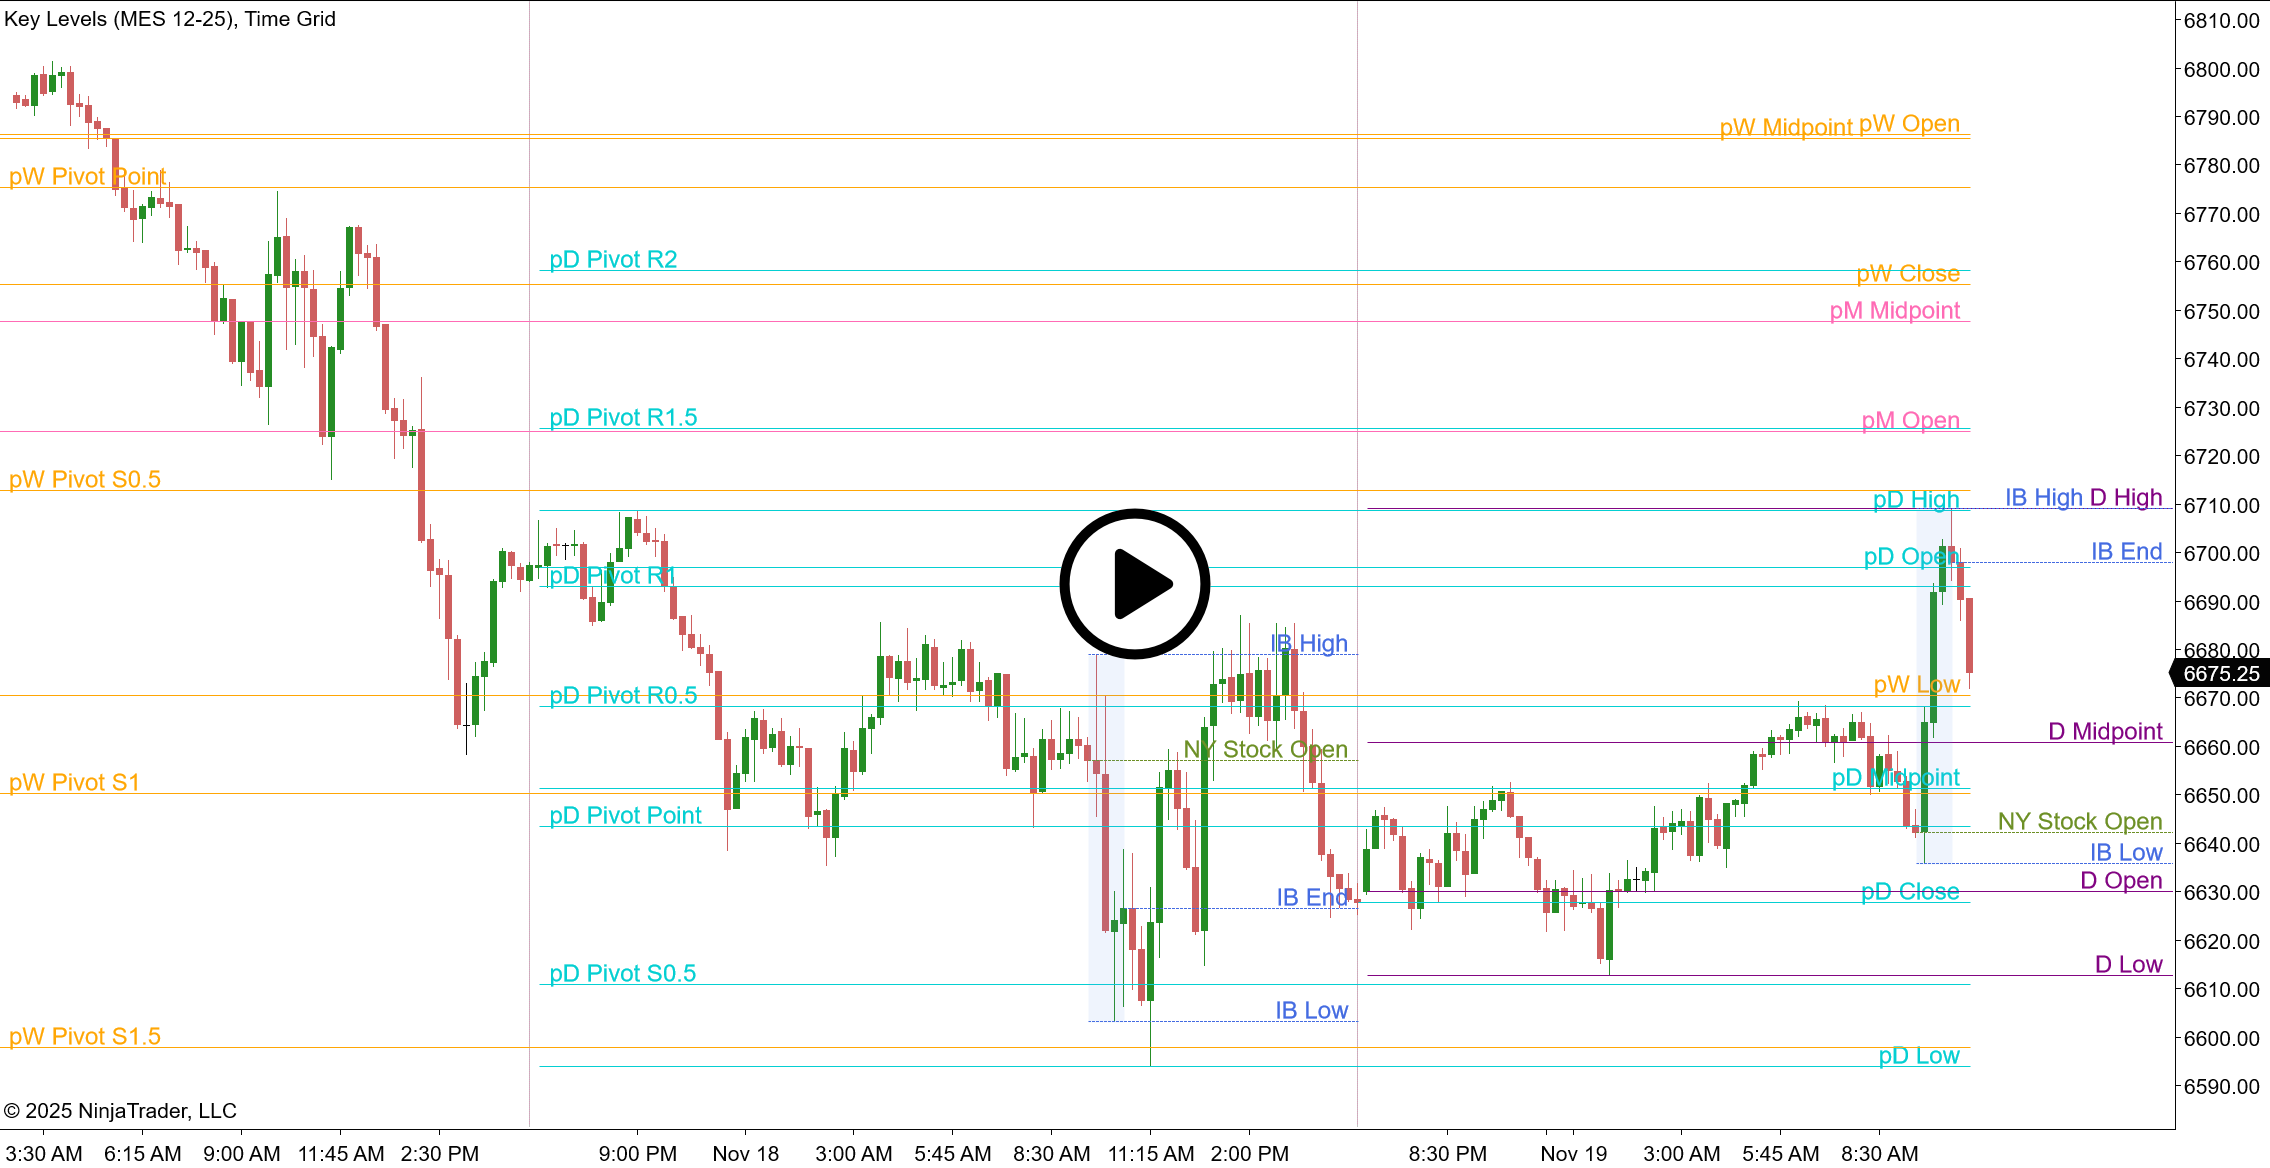
Display Open, High, Low, Close, and Midpoint from:
- Previous Day — spot yesterday’s key levels at a glance
- Previous Week — identify longer-term support and resistance
- Previous Month — see the major price zones institutions watch
Find support & resistance automatically
Select the pivot calculation method that fits your trading strategy:
- Classic Pivots
- Camarilla
- DeMark
- Fibonacci
- Woodie
Apply these pivots across previous Day, Week, and Month timeframes for maximum insight, all calculated automatically from a single indicator.
Monitor pre-market, opening range & international sessions
Create personalized Intraday time zones to track:
- Pre-market and after-hours price action
- Initial Balance zones at the open
- London or Asian session ranges
- NYSE opening bell price levels
Each custom session displays its Open, High, Low, Close, and Midpoint—with full control over timing and time zones.
Project price targets from overnight & weekend gaps
Automatically plot projection levels from overnight or weekend gaps—similar to Fibonacci extensions. Set custom percentages (50%, 100%, 150%, etc.) to project potential price targets based on gap ranges.
Choose your closing price reference for Futures
For futures traders: Choose between exchange settlement prices or intraday chart data for more accurate level calculations on your preferred instruments.
Full customization, zero clutter
- Smart Label Placement: Position labels left, right, or at the last bar—keeping your chart organized and readable.
- Custom Labels: Edit any label text. Include price values automatically with a simple character code.
- Line Styling: Adjust color, thickness, dash style, and opacity for every single level.
- Selective Display: Show only the levels you want. Hide everything else. Your chart, your rules.
Trusted by active traders
Loved by 2 customers — add it to your collection and you'll love it too!
Want to explore all the features in detail?
Our comprehensive user guide covers setup, advanced functionality, and pro tips. View the user guide
Perfect for…
- Day Traders: Mark the previous day’s high and low in seconds. Add the NYSE open price as a custom session. Track how price respects (or breaks) these levels throughout the session.
- Swing Traders: Plot previous week and month levels to identify major support and resistance zones. Use pivot points to confirm potential reversal areas.
- Futures Traders: Use settlement-based levels for accurate daily open gaps. Create custom sessions for overnight or Asian session ranges.
- Multi-Timeframe Traders: Display daily, weekly, and monthly levels simultaneously. Quickly identify confluence zones where multiple timeframes align.
Start trading with Key Levels today
Stop manually marking your charts. Let Key Levels handle the repetitive work while you focus on finding high-probability trades.
Key Levels
Indicator for NinjaTrader 8.
Lifetime License.
Pay once, use forever on 1 computer.
Free updates for 1 year.
30-day money-back guarantee.
Compatible with NinjaTrader 8 desktop version 8.1.2.0 or later.
Not compatible with NinjaTrader Mobile Trading App.
Not ready for a one-time purchase? Try our Subscription service to enjoy all our products.
Common questions
Does this work with stocks, forex, and futures?
Yes. Key Levels works with any instrument supported by NinjaTrader 8.
Can I display only specific levels to keep my chart clean?
Absolutely. Every level can be shown or hidden individually. Display only what’s relevant to your strategy.
How do the custom intraday sessions work?
Define a start time (and optionally an end time) for up to 4 sessions. The indicator will automatically track and display Open, High, Low, Close, and Midpoint for each session. Perfect for pre-market analysis, initial balance tracking, or international session ranges.
What’s the difference between Settlement and Intraday data?
Settlement uses the official exchange settlement price (important for futures traders). Intraday uses the last traded price on your chart timeframe. Both options are available depending on your needs.
Can I customize the colors and label text?
Yes. Every aspect of the indicator is customizable—colors, line styles, label text, and positioning.