Master time on your charts with the perfect vertical grid
Our Vertical Grid tool gives you complete control over time-based reference lines, making market structure instantly visible and pattern recognition effortless.
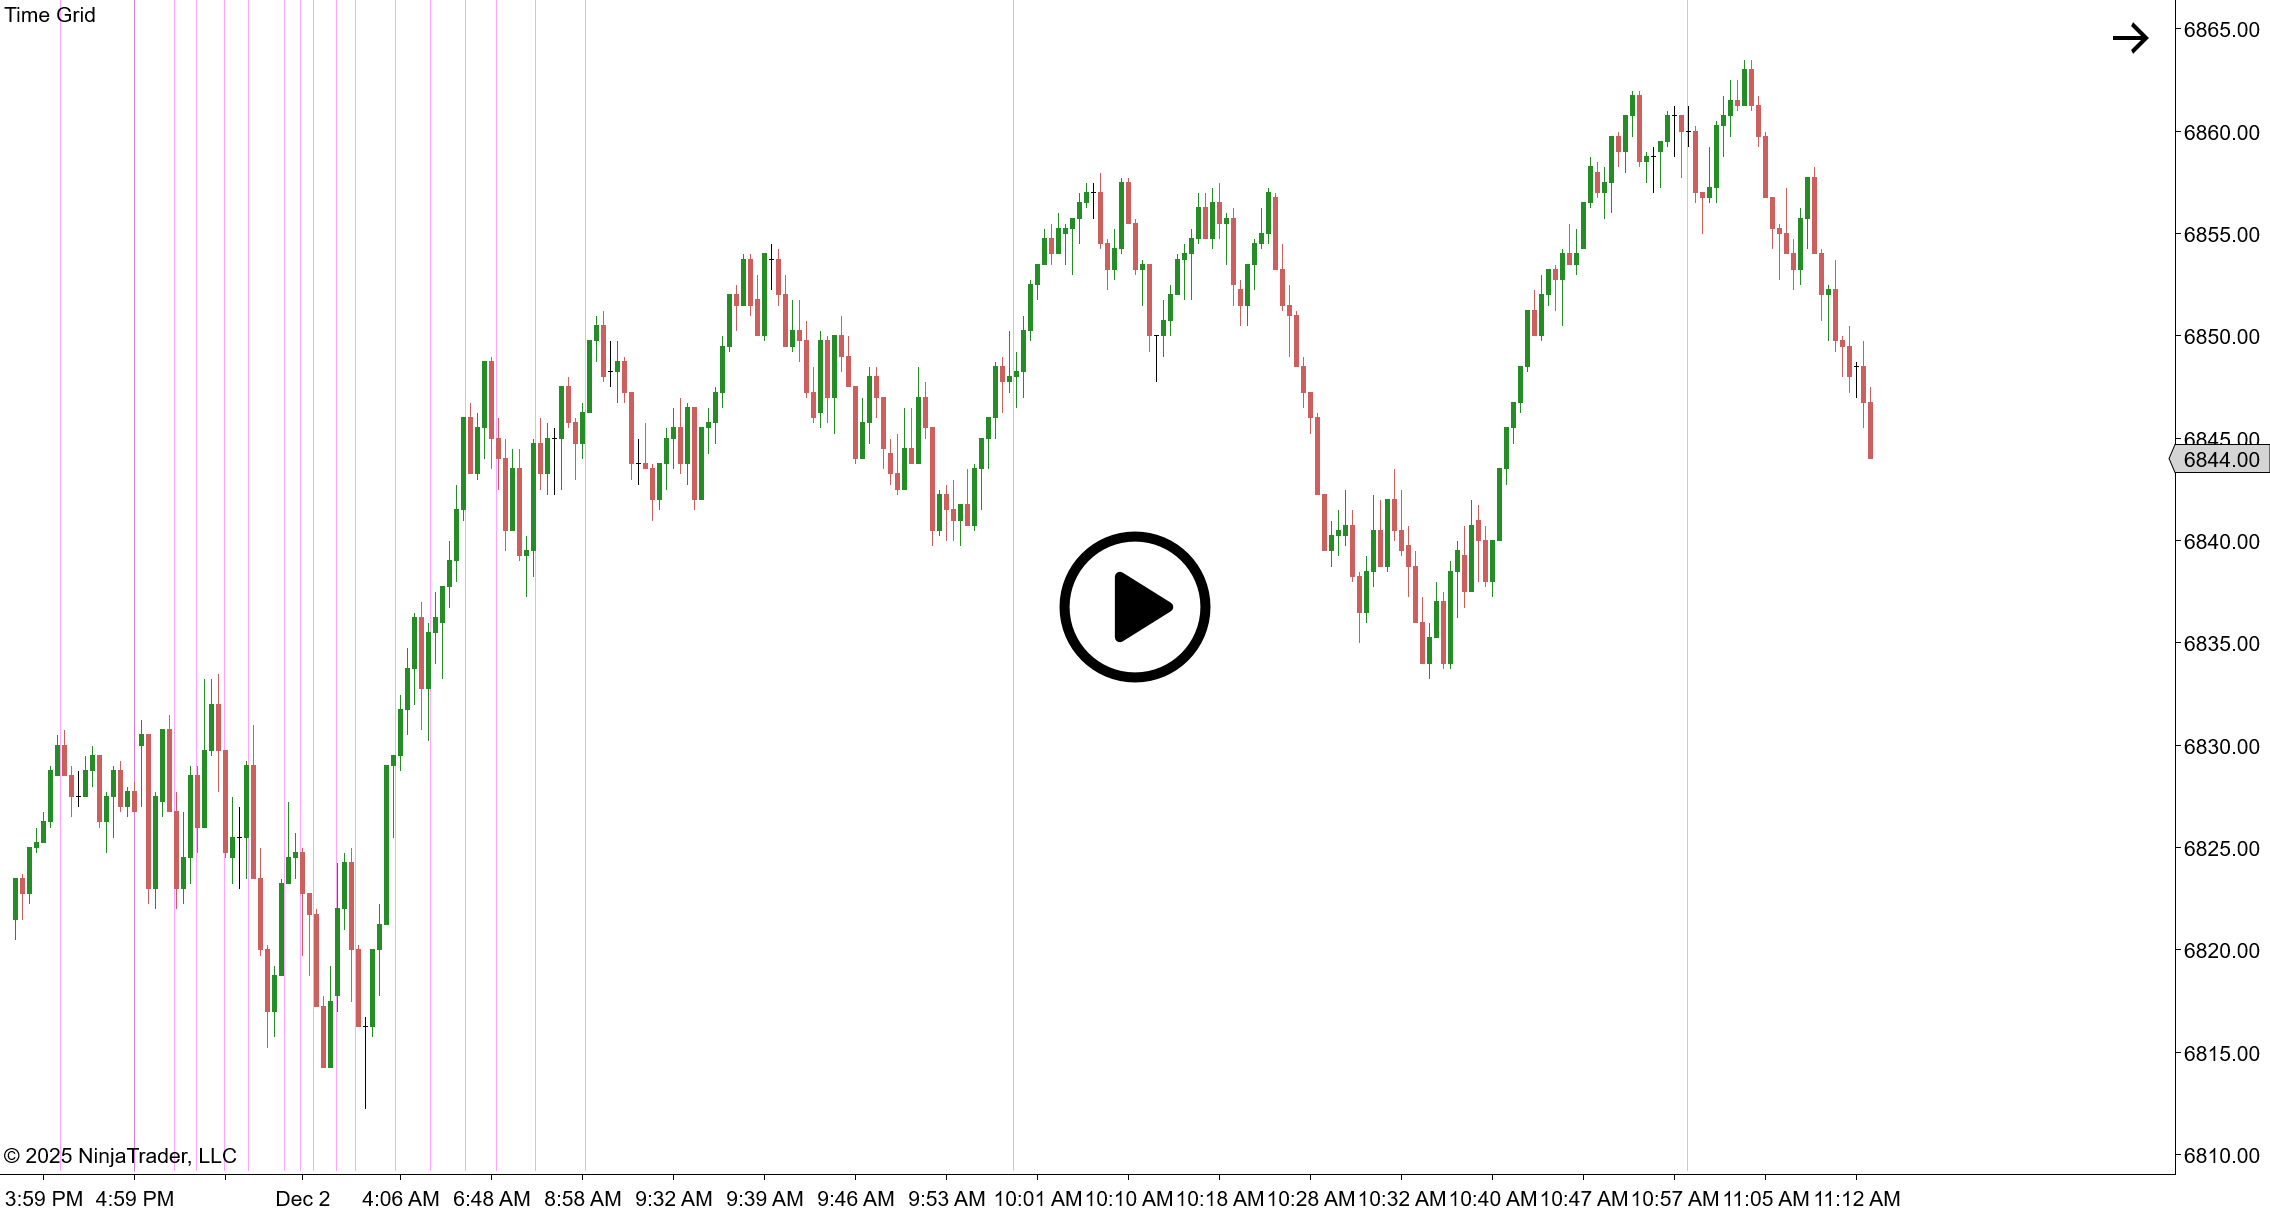
Never miss a key time zone
Instantly identify session, weekly, monthly, quarterly and yearly boundaries, and critical intraday times without counting bars or squinting at labels.
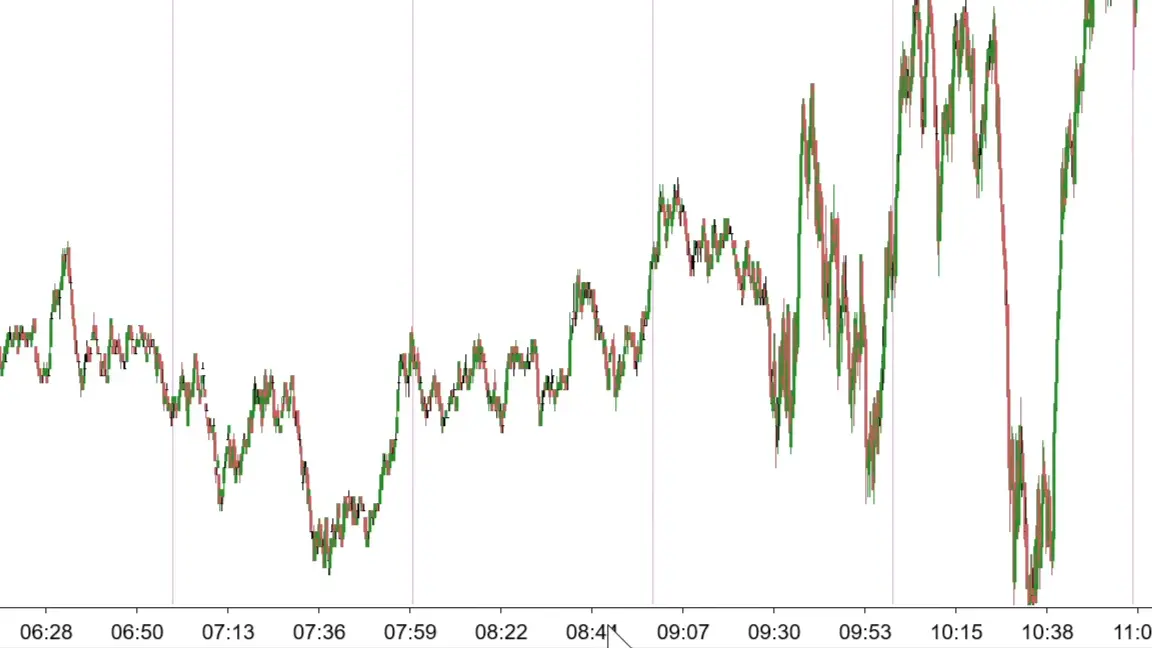
Works with all chart types
Not just time-based charts. Our Vertical Grid tool provides essential time references even on tick, volume, and range bars where time context is typically lost.
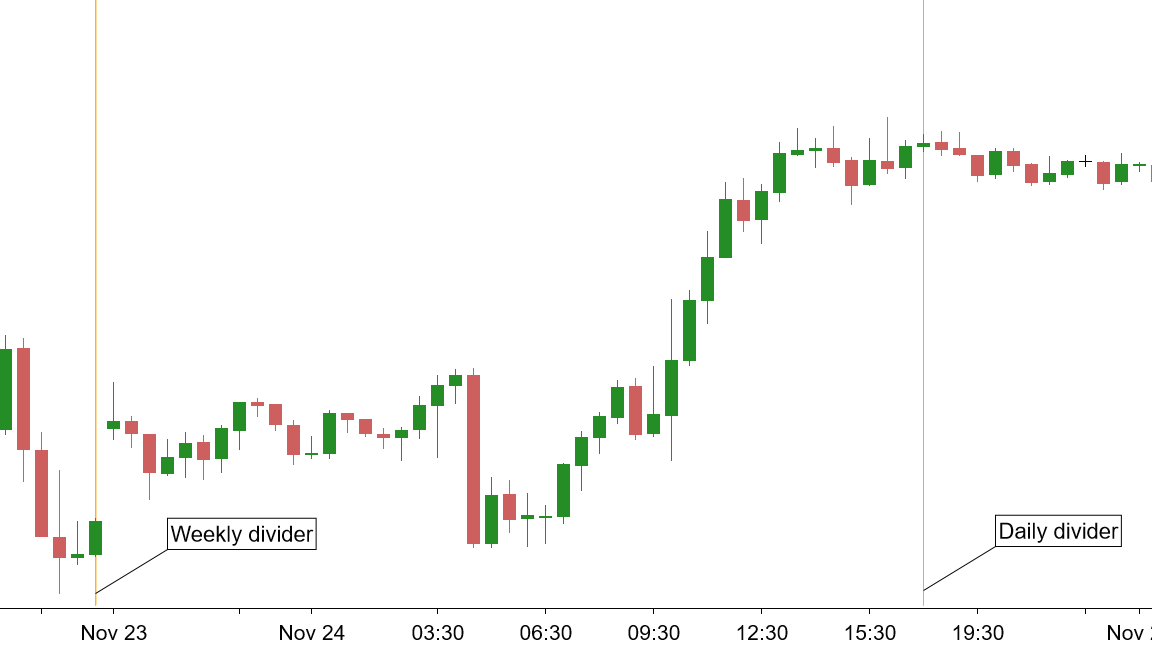
Every time interval your strategy needs—automatically marked
Whether you’re tracking quarterly earnings cycles or timing entries to the minute, Vertical Grid automatically places reference lines exactly where you need them, making time-based analysis effortless.
Available Time References:
- Yearly & Quarterly – Track long-term cycles and seasonal patterns
- Monthly – Identify monthly highs, lows, and trend changes
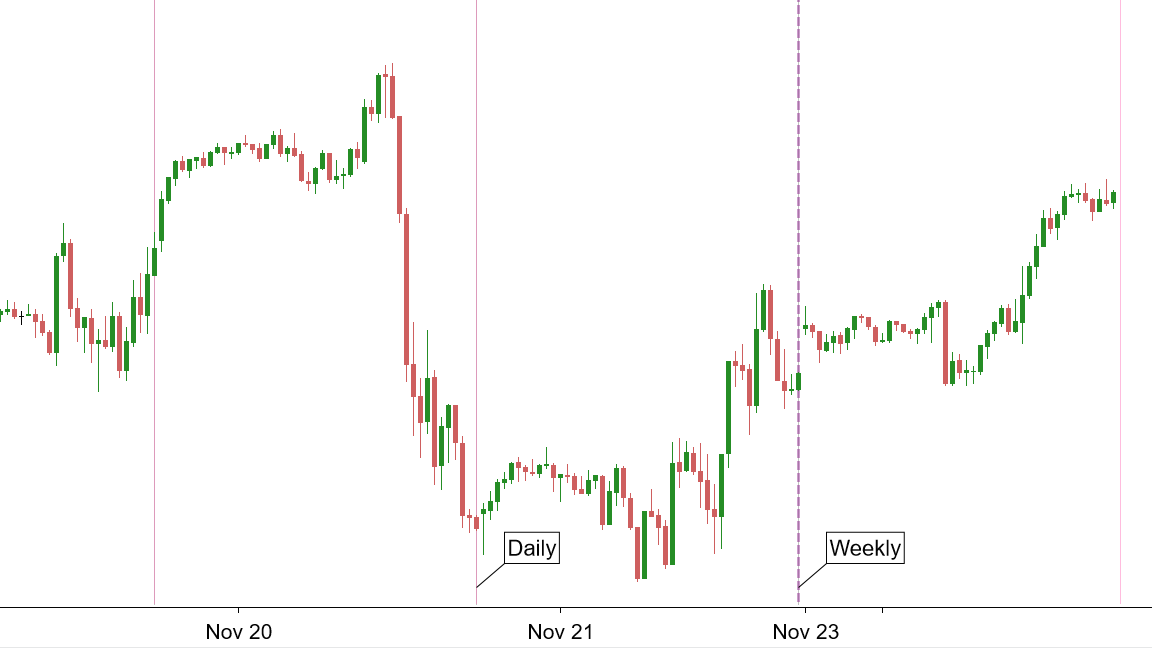
- Weekly – Follow swing structures and weekly pivot zones
- Daily – Mark session boundaries with crystal clarity
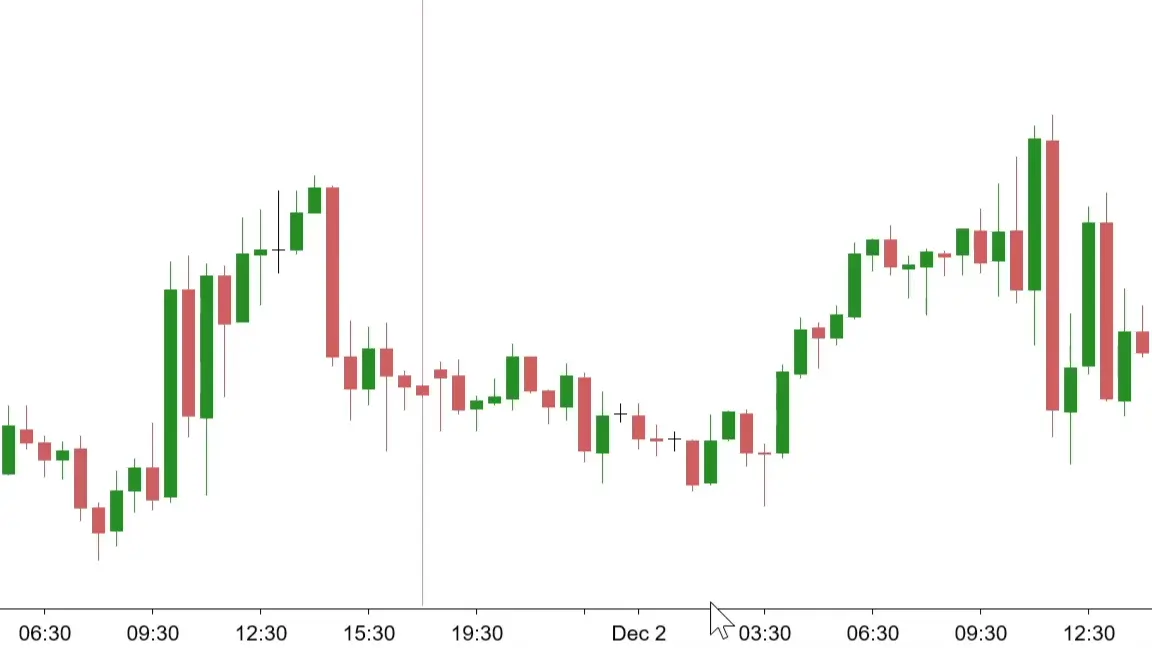
- Hourly – Perfect for day traders tracking intraday rhythm
- Custom Minutes – Set intervals like every 3, 5 or 15 minutes for precise entries
- Fixed Intraday Times – Highlight market opens, closes, and key news release times (9:30, 16:00, etc.)

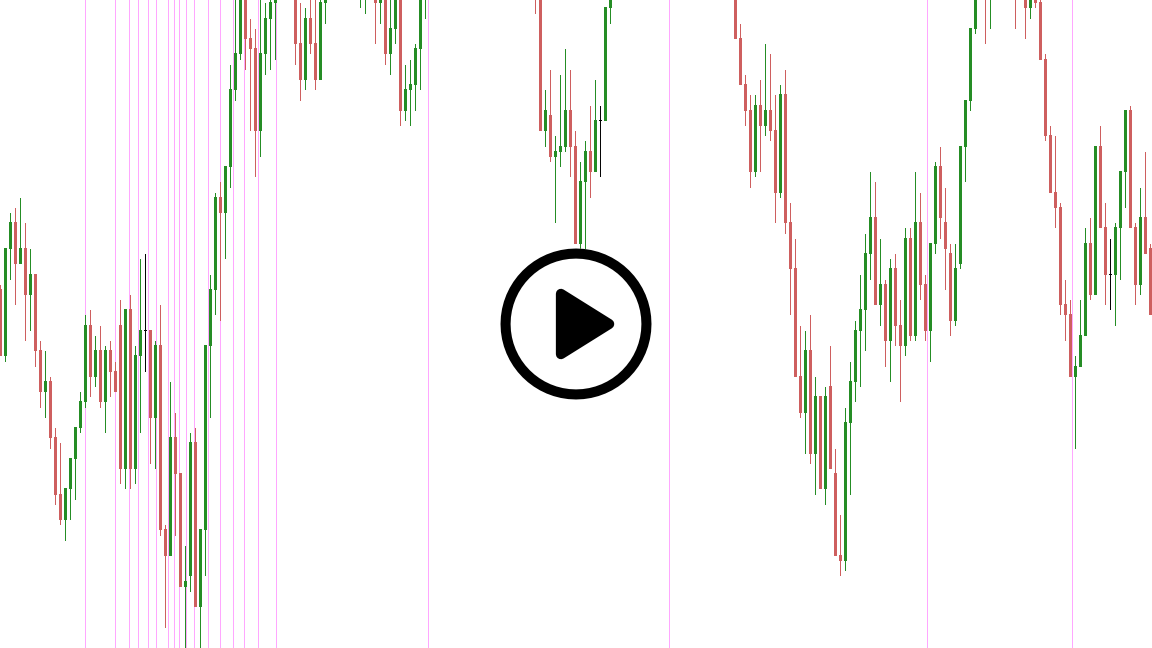
Adapts to any timeframe
Smart visibility logic automatically hides lines that would clutter your view. Zoom in for minute-by-minute precision, zoom out for macro perspective—the grid adjusts intelligently but consistently.
Your chart, your style
Customize every line type independently. Subtle daily dividers, bold weekly markers, highlighted session breaks—design the visual hierarchy that matches your trading methodology.
Journal-ready screenshots
Easily show or hide the visible date range and current time in the chart’s bottom right corner. This is perfect for documenting trades and improving your edge.
5 preset zoom levels
Right-click access to your favorite chart views. Stop manually adjusting bar spacing—lock in your preferred perspectives and switch between them instantly.
Want to explore all the features in detail?
Our comprehensive user guide covers setup, advanced functionality, and pro tips. View the user guide
The visual foundation for consistent trading
Profitability comes from consistency. Consistency comes from having consistent reference points you can trust trade after trade, day after day.
Vertical Grid gives you permanent, customizable time markers that make pattern recognition faster, setup identification clearer, and your entire analytical process more systematic. It’s the visual foundation serious traders build on.
Vertical Grid
Indicator for NinjaTrader 8.
Lifetime License.
Pay once, use forever on 1 computer.
Free updates for 1 year.
30-day money-back guarantee.
Compatible with NinjaTrader 8 desktop version 8.1.2.0 or later.
Not compatible with NinjaTrader Mobile Trading App.
Not ready for a one-time purchase? Try our Subscription service to enjoy all our products.
Common questions
Does this replace NinjaTrader’s built-in grid?
Yes. We recommend disabling NT8’s default grid lines for the cleanest display. Vertical Grid gives you far more control and intelligence.
Will it slow down my charts?
No. The indicator is optimized to calculate on bar close by default, ensuring minimal CPU impact even on multiple chart setups.
Can I use different settings on different charts?
Absolutely. Each chart instance can have completely independent configurations—perfect if you use different timeframes or strategies.
Does it work with Renko, Range, or Point & Figure charts?
Yes! Vertical Grid works with all NinjaTrader chart types, providing valuable time context even on non-time-based intervals.
How hard is it to set up?
Very simple. The user guide walks you through everything, and most traders have their ideal setup running in under 5 minutes.