Extending Horizontal Line drawing tool for NinjaTrader 8
$58.00
Quickly draw from a single click a horizontal line that extends from the Open, High, Low or Close of a bar to the right side of your NinjaTrader 8 charts.
Description
From one click on your chart, this drawing tool for NinjaTrader 8 draws a horizontal line that extends from the selected bar price value to the right side of the chart:
The line can be created from the following bar price values:
- Open
- High
- Low
- Close
- Midpoint from the candle body (midpoint from open to close)
- Midpoint from the candle (midpoint from low to high)
- Midpoint from the candle upper or lower wick
- or the line can be created from a single click anywhere on your chart
This makes annotating charts faster. It’s also very handy to have text associated with lines so it’s easier to remember what makes this level important or what action to take around that level.
The following options are also available:
- Annotation text automatically created from the selected bar price value. This text can be edited. Option to make this text always visible, only visible when the line is selected or never visible.
- Option to align the text to the left, right or the middle of the line.
- Option to make the line visible only from the chart interval drawn from and lower or higher.
- Option to extend the line to the left.
- Option to change the line color and style.
- Option to predefined line style for up to 9 chart intervals (period).
- Comes with predefined line style for Monthly, Weekly, Daily and 1 hour charts which are customizable.
- Option to show the price at which the line is drawn as a label visible at the line right edge.
This tool is exclusively compatible with the desktop version of NinjaTrader; the NinjaTrader Mobile Trading App is not supported.
Release notes
version 6.1 – November 14, 2024
- Improve stability by addressing a rare occurrence of an unhandled exception error.
version 6.0 – August 4, 2023
- New option to draw the line from the bar open time.
- New visibility option. You now have the option to make the Line visible only on the chart interval you drew the line from.
You also have a new option to make the line visible only on the selected chart intervals. To use this new option, the Interval visibility needs to be set to “Selected_Interval”. Then the values from the setting group “If Interval visibility = Selected_Interval” are used to determine if the rectangle should be visible or not. - New line type: 50% of the wick
- Add option to create custom @DATE string by adding the desired date/time format in parenthesis. For example you could use @DATE(HH:mm) which will print 15:45. Or you could use @DATE(MM/dd) which will print 05/13.
The complete list of available characters is available in the user guide which you can access under the GUIDE tab on the product webpage. - Fix saving the text color in Templates
version 5.0 – December 6, 2022
- Add option to draw the line either in front or behind the chart bars.
- Add new option called “Cut drawing here” when you right click on a line. When selected, the drawing anchor point will move to where the mouse cursor was when opening the context menu. If the mouse was on the left of the most left anchor then the line will start from this new position. When selecting cut drawing here, the associated extension is automatically deactivated for that side of the line.
- Add a second anchor (To Anchor). This allows to select where the right side of the line needs to end.
- Add option to hold the Alt key to move freely the From Anchor (move in both X and Y directions). When holding the shift key the price doesn’t change and only the bar change. When not pressing any modifier key, price will follow the bar snapping price reference.
- Bug fix: Now the default text string can be empty and the preset text will be visible when selected. Before the default text string needed to be not empty.
- Bug fix: When trying to draw a line that needs bar price values in the right margin where there is no bar, the drawing will stay in build (pen cursor) until the user click over an existing bar.
version 4.0 – October 18, 2022
- When you right click on a line, you can now extend it to the Left.
- When you right click on a line, you can now show or hide the price label.
- Annotation text can now be saved in the template.
- Option to draw all lines with the same color.
- You can now define up to 5 custom text fields. These predefined text fields can quickly be selected from the right click context menu.
- You can now move the lines in both X and Y directions. Holding the Shift key down will move on X only (Horizontally only).
version 3.1 – May 31, 2022
- The lines are now down behind the chart bars
- Add default color for 5 minutes chart
- Improve the reliability for drawing lines on a chart with multiple Data Series on the same panel or on a chart with Data Series on multiple panels
- Add icon for the drawing tool menu and the Drawing Tool Tile
version 3.0 – May 27, 2021
- Add free form option to draw the line from one click anywhere on the chart
version 2.0 – October 4, 2020
- Initial release.
Terms
By purchasing this Product you get a lifetime License for one computer. You also get one year of free updates. At the end of this year of free updates your product will keep working normally, however you will no longer have access to the updates for free. The purchased version and updates will be downloadable from your My account page on this website.
Whenever you wish, you can purchase an update license at 80% to 90% discount of the Product regular selling price to extend your license with another year of free updates.
100% Satisfaction Guarantee
If you’re not satisfied, we’re not satisfied. That’s our commitment and your risk-free 30 days 100% money back guarantee.
This Product is compatible with NinjaTrader® 8 only.
All prices are in US$.
Please feel free to contact us with any questions.
By purchasing this Product, you acknowledge that you have read and agree to all Terms.
“NinjaTrader® is a registered trademark of NinjaTrader Group, LLC. No NinjaTrader company has any affiliation with the owner, developer, or provider of the products or services described herein, or any interest, ownership or otherwise, in any such product or service, or endorses, recommends or approves any such product or service.”
Guide
How to draw the Horizontal Line
The Extending Horizontal Lines are drawing tools and they are accessible from the Drawing Tools menu from your charts. You can also add you preferred Extending Lines types to the Drawing Tools Tile indicator. Another way to quickly start drawing Extending Lines is to create a Hot Key.
Hot tip:
When the Line is not locked, you can hold the Shift key down to move the selected anchor on the horizontal axis only. You can hold the Alt key down to move freely the selected anchor in both axis. If you don’t hold any keys and you move the origin (start anchor) of the line, the line will snap to the price of the new bar according to the line type (ie if you move line from bar low, the line to snap to the low of the new moved to bar).
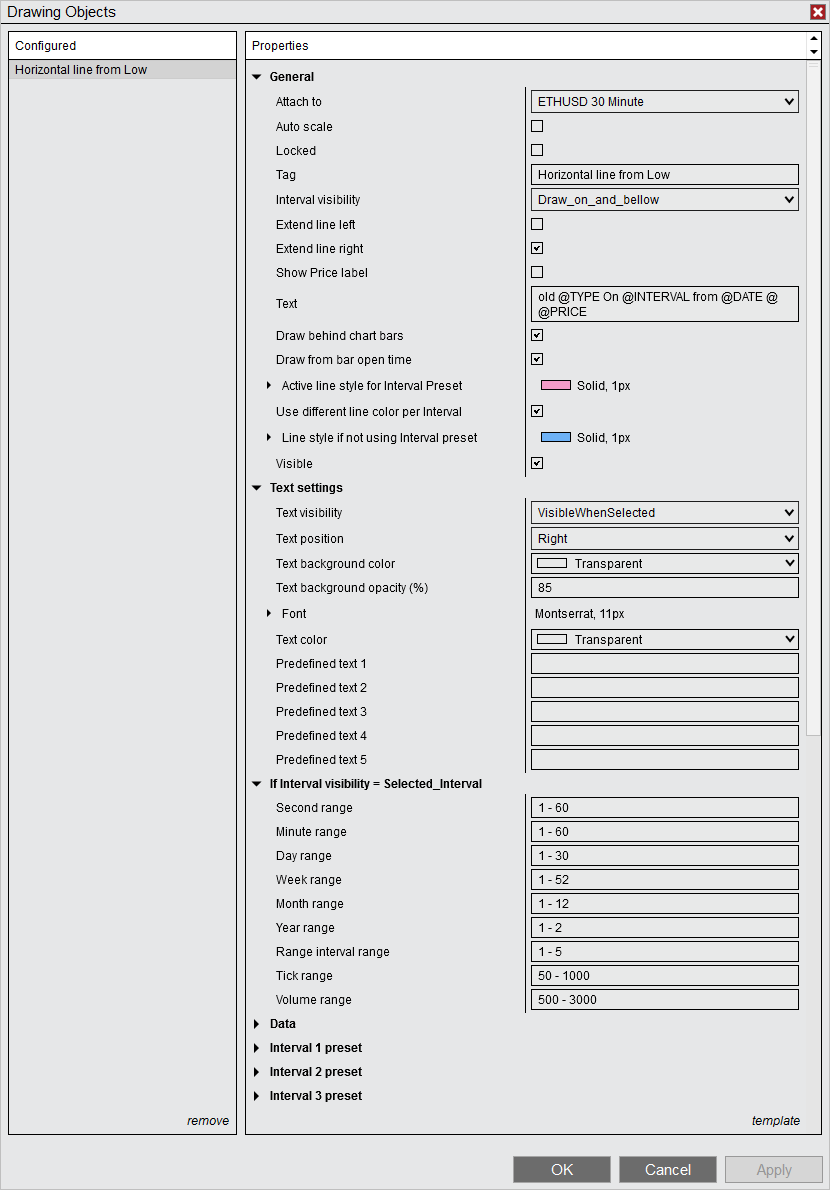
Screenshot of the Properties window of an Extending Horizontal Line with description of each setting below.
Locked:
If you would like to get the line locked automatically when you finish drawing it, for example to prevent to accidentally move it when you scroll your chart with the mouse, you can activate the “Locked” option and then save the settings as a Default Template by clicking on “template” then “save” then “Save as Default”.
Interval visibility:
This setting allows you to see the Line on either any chart intervals (Timeframe) or only on the interval from which you drew the Line from and lower or higher interval.
For example, you draw a Line on a 60 minutes chart interval with the interval visibility set to “Draw_on_and_below” and then if you change the chart interval to 1 day (higher timeframe) the Line will be hidden. If you change the chart interval to 15 minutes (lower timeframe), the Line will be visible. This setting allows to go back to a higher timeframe and not get the chart clutter with many lower timeframe drawings.
If you set the Interval visibility to “Draw_on_only”, the Line will be visible only on the chart interval you drew it from. So from the above example, it will be visible only on the 60 minutes chart interval.
If you set the Interval visibility to “Draw_on_and_above”, the Line will be visible on the chart interval you drew it from and on higher intervals. So from the above example, the Line will be visible on the daily interval but will be hidden on the 15 minutes interval.
If you set the Interval visibility to “All”, the Line will always be visible regardless of the chart interval.
If you set the Interval visibility to “Selected_Interval”, the Line will only be visible on the selected chart interval defined under the section If Interval visibility = Selected_Interval.

As per the image above, the line will be visible on a second chart from 1 to 60 seconds. If the interval of the second chart is 90 seconds, the line will not be visible. You can change the range of each interval type by entering two integer number separated by the dash ‘-‘ character. If you want the line to be visible only on a specific chart interval, for example 15 minutes, under the Minute range you will input 15 – 15.
Extend line left:
When this option is active, the left side of the Line will extend to the left edge of the chart.
You can also activate or deactivate this option from the right click context menu.
Extend line right:
When this option is active, the right side of the Line will extend to the right edge of the chart.
You can also activate or deactivate this option from the right click context menu.

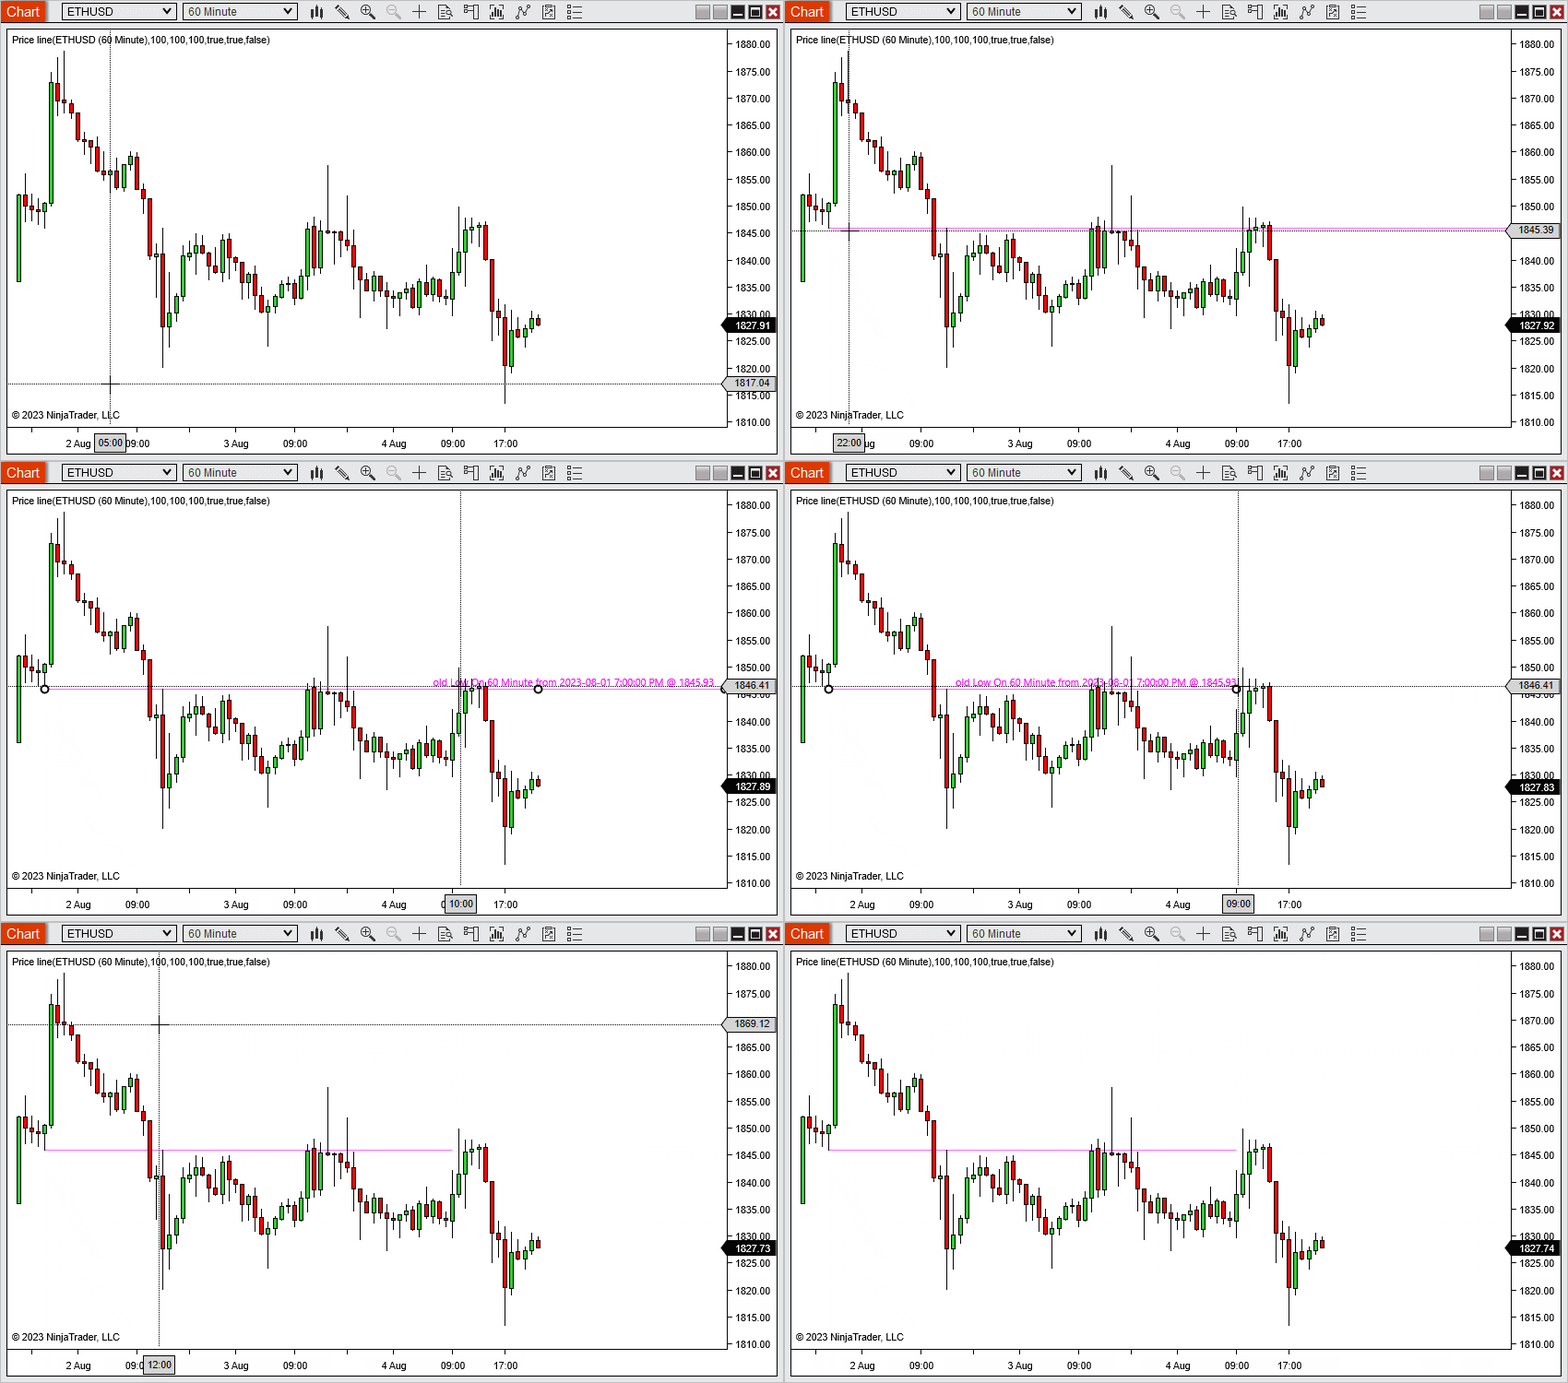
Cut drawing here
From the right click menu, there is an option called Cut drawing here. When you click on this menu selection, the line will be cut where the mouse cursor was when you right clicked.
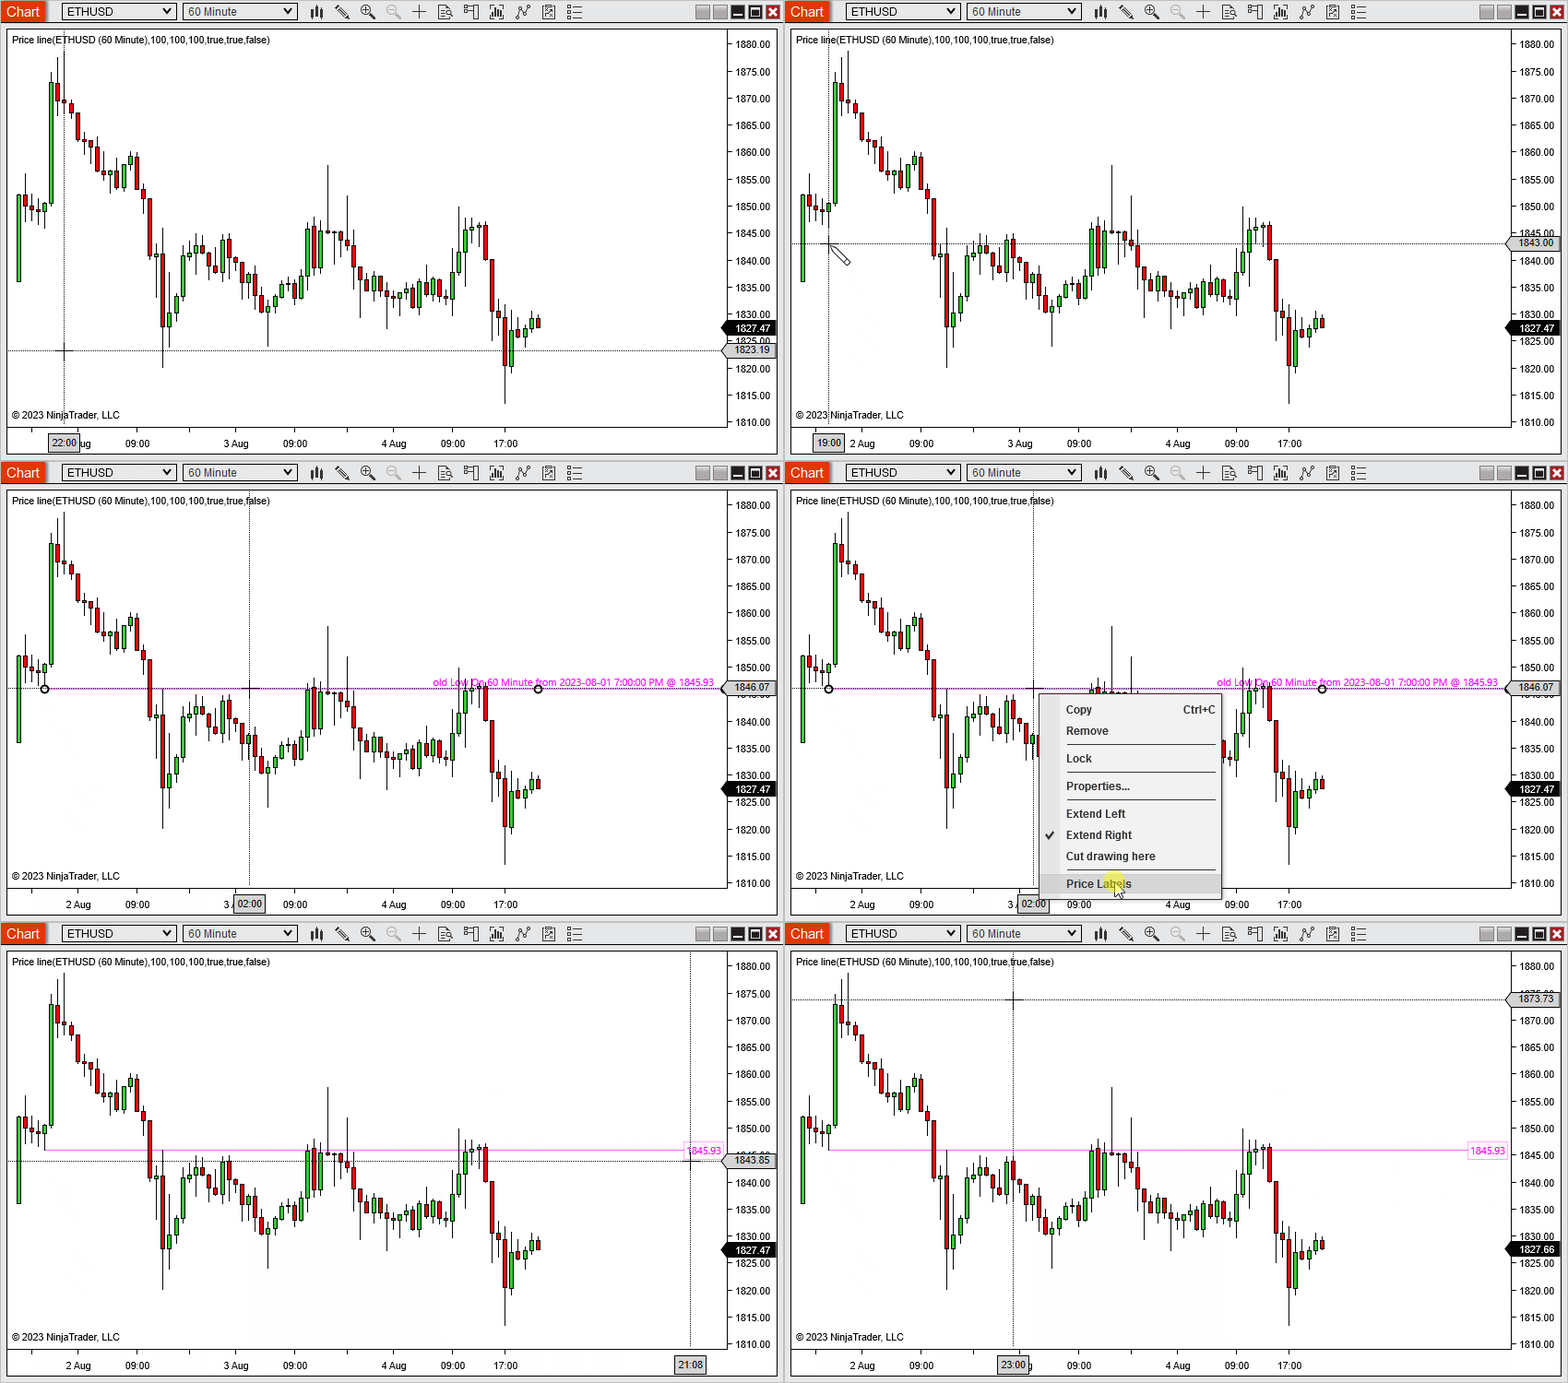
Show price label:
When this option is active, a price label will be visible for the price values of the line.
Text
You can see a text annotation on the Line by using this Text field.

By default the Text field is pre-filled with: @TYPE On @INTERVAL from @DATE
Please note you can use the following special strings to build your custom dynamic annotation.
@TYPE : This string will be replaced by the type of Line drawn. For example, a High, a Low or a candle body midpoint.
@INTERVAL : This string will be dynamically replaced by the chart interval you drew the Line from.
@DATE : This string will be dynamically replaced by the date the Line is drawn from.
@DATE() : You can customize the date format by adding the desired format specifier inside the parenthesis. For example @DATE(HH:MM) or @DATE(mm/dd) or @DATE(mm/dd HH:MM)
List of available format specifier to choose from:
| Format specifier | Description | Example |
|---|---|---|
| “d” | The day of the month, from 1 through 31. | 2009-06-01 13:45:30 -> 1 2009-06-15 13:45:30 -> 15 |
| “dd” | The day of the month, from 01 through 31. | 2009-06-01 13:45:30 -> 01 2009-06-15 13:45:30 -> 15 |
| “ddd” | The abbreviated name of the day of the week. | 2009-06-15 13:45:30 -> Mon (en-US) 2009-06-15 13:45:30 -> Пн (ru-RU) 2009-06-15 13:45:30 -> lun. (fr-FR) |
| “dddd” | The full name of the day of the week. | 2009-06-15 13:45:30 -> Monday (en-US) 2009-06-15 13:45:30 -> понедельник (ru-RU) 2009-06-15 13:45:30 -> lundi (fr-FR) |
| “h” | The hour, using a 12-hour clock from 1 to 12. | 2009-06-15 01:45:30 -> 1 2009-06-15 13:45:30 -> 1 |
| “hh” | The hour, using a 12-hour clock from 01 to 12. | 2009-06-15 01:45:30 -> 01 2009-06-15 13:45:30 -> 01 |
| “H” | The hour, using a 24-hour clock from 0 to 23. | 2009-06-15 01:45:30 -> 1 2009-06-15 13:45:30 -> 13 |
| “HH” | The hour, using a 24-hour clock from 00 to 23. | 2009-06-15 01:45:30 -> 01 2009-06-15 13:45:30 -> 13 |
| “m” | The minute, from 0 through 59. | 2009-06-15 01:09:30 -> 9 2009-06-15 13:29:30 -> 29 |
| “mm” | The minute, from 00 through 59. | 2009-06-15 01:09:30 -> 09 2009-06-15 01:45:30 -> 45 |
| “M” | The month, from 1 through 12. | 2009-06-15 13:45:30 -> 6 |
| “MM” | The month, from 01 through 12. | 2009-06-15 13:45:30 -> 06 |
| “MMM” | The abbreviated name of the month. | 2009-06-15 13:45:30 -> Jun (en-US) 2009-06-15 13:45:30 -> juin (fr-FR) 2009-06-15 13:45:30 -> Jun (zu-ZA) |
| “MMMM” | The full name of the month. | 2009-06-15 13:45:30 -> June (en-US) 2009-06-15 13:45:30 -> juni (da-DK) 2009-06-15 13:45:30 -> uJuni (zu-ZA) |
| “s” | The second, from 0 through 59. | 2009-06-15 13:45:09 -> 9 |
| “ss” | The second, from 00 through 59. | 2009-06-15 13:45:09 -> 09 |
| “t” | The first character of the AM/PM designator. | 2009-06-15 13:45:30 -> P (en-US) 2009-06-15 13:45:30 -> 午 (ja-JP) 2009-06-15 13:45:30 -> (fr-FR) |
| “tt” | The AM/PM designator. | 2009-06-15 13:45:30 -> PM (en-US) 2009-06-15 13:45:30 -> 午後 (ja-JP) 2009-06-15 13:45:30 -> (fr-FR) |
| “yy” | The year, from 00 to 99. | 0001-01-01 00:00:00 -> 01 0900-01-01 00:00:00 -> 00 1900-01-01 00:00:00 -> 00 2019-06-15 13:45:30 -> 19 |
| “yyy” | The year, with a minimum of three digits. | 0001-01-01 00:00:00 -> 001 0900-01-01 00:00:00 -> 900 1900-01-01 00:00:00 -> 1900 2009-06-15 13:45:30 -> 2009 |
| “yyyy” | The year as a four-digit number. | 0001-01-01 00:00:00 -> 0001 0900-01-01 00:00:00 -> 0900 1900-01-01 00:00:00 -> 1900 2009-06-15 13:45:30 -> 2009 |
| “yyyyy” | The year as a five-digit number. | 0001-01-01 00:00:00 -> 00001 2009-06-15 13:45:30 -> 02009 |
| “:” | The time separator. | 2009-06-15 13:45:30 -> : (en-US) 2009-06-15 13:45:30 -> . (it-IT) 2009-06-15 13:45:30 -> : (ja-JP) |
| “/” | The date separator. | 2009-06-15 13:45:30 -> / (en-US) 2009-06-15 13:45:30 -> – (ar-DZ) 2009-06-15 13:45:30 -> . (tr-TR) |
Draw behind chart bars:
By default the Lines are drawn behind the chart bars.
If you prefer to draw the Lines in front of the chart bars, unselect this option then click on “template” at the bottom of the Properties window, click on “save“, then click on “Save as Default”.
The next time you draw this line type, it will be drawn in front of the chart bars.
Please note that this setting has to be set in a Default Template to be effective.
Draw from bar open time:
When this option is active, the line will be drawn from the bar opening time. This feature only works with Month, Week, Day and Minutes chart intervals. When you go to a lower chart interval you will see the line starts from the opening time of the bar you clicked on to draw it. 
Active line style for Interval Preset:
These settings allow you to see and change the current Line drawing appearance.
Use different color per Interval
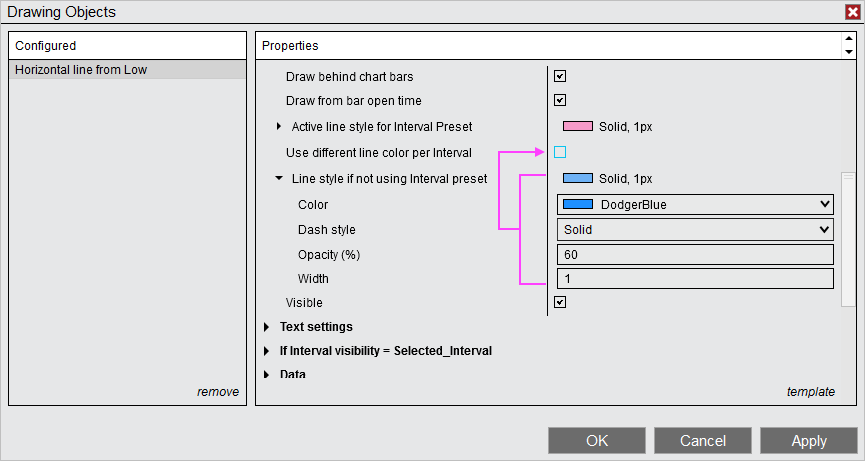
By default the option “Use different color per Interval” is active which means the Line will be drawn in different color depending on which chart interval (timeframe) you draw it. You can define your own preferred line style for up to 9 chart intervals by using the Interval 1 to 9 preset sections.
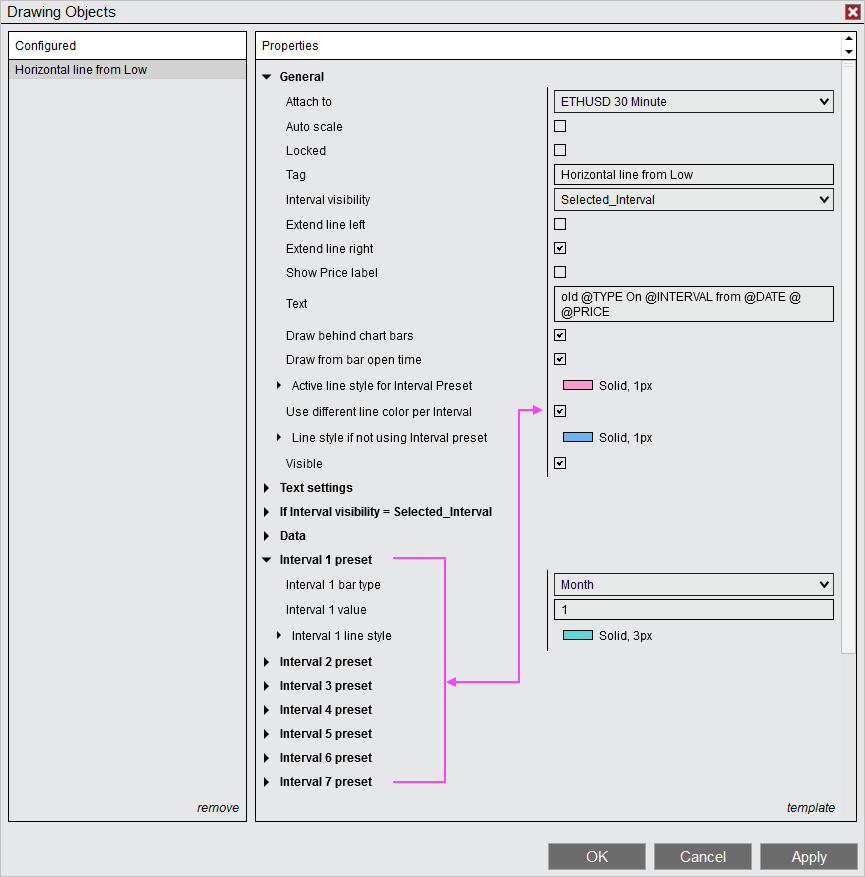
You can use a single chart interval by entering a single number in the Interval value as per the Interval 3 value for the Day interval type in the image below.
You can also use a range of chart interval by entering two numbers separated by the dash character ‘-‘ as per the Interval 5 value for the Minute interval type in the image below.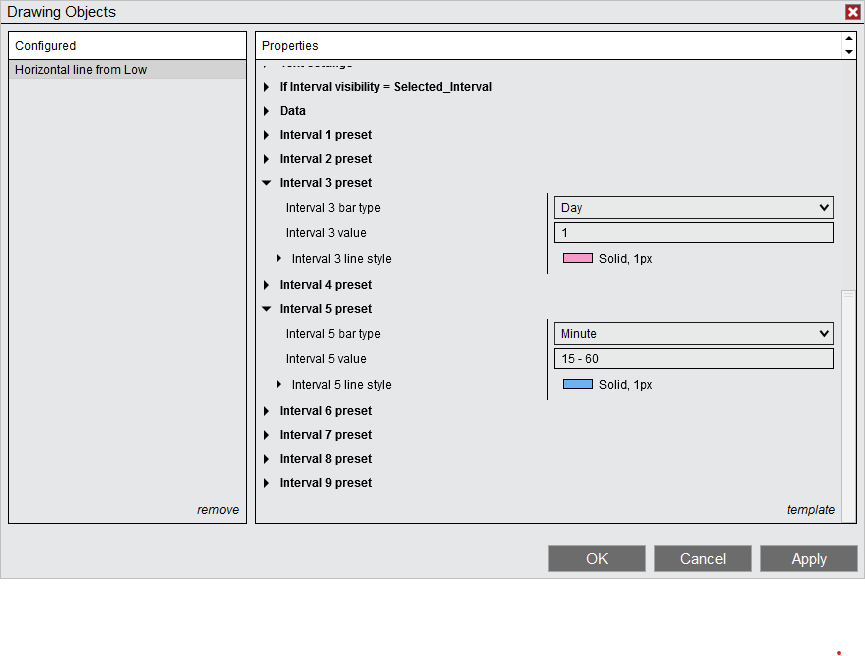
When the option “Use different color per Interval” is not active the Lines will always be drawn with the same color and line stype as defined by the following setting “Line if not using Interval preset”.
Text visibility:
You can select from:
- AlwaysVisible
- The text will always be visible.
- VisibleWhenSelected
- The text will be visible when you click on the drawing tool. Otherwise it will be hidden.
- VisibleOnLowerTimeframe
- When the Interval visibility option is set to All, this setting will show the text only on the timeframe from which you drew the line and lower. The text will be hidden on higher timeframe.
- DoNotShow
- The text will always be hidden.
Text position
You can select from Right, Left or Middle. The text will be horizontally aligned accordingly within the Line.
Text background color
You can change the background color of the text with this setting.
Text background opacity (%)
You can change the opacity of the text background color with this setting.
Text font
You can change the text font family, the font size, italic and bold with this setting.
Text color
You can change the text color with this setting.
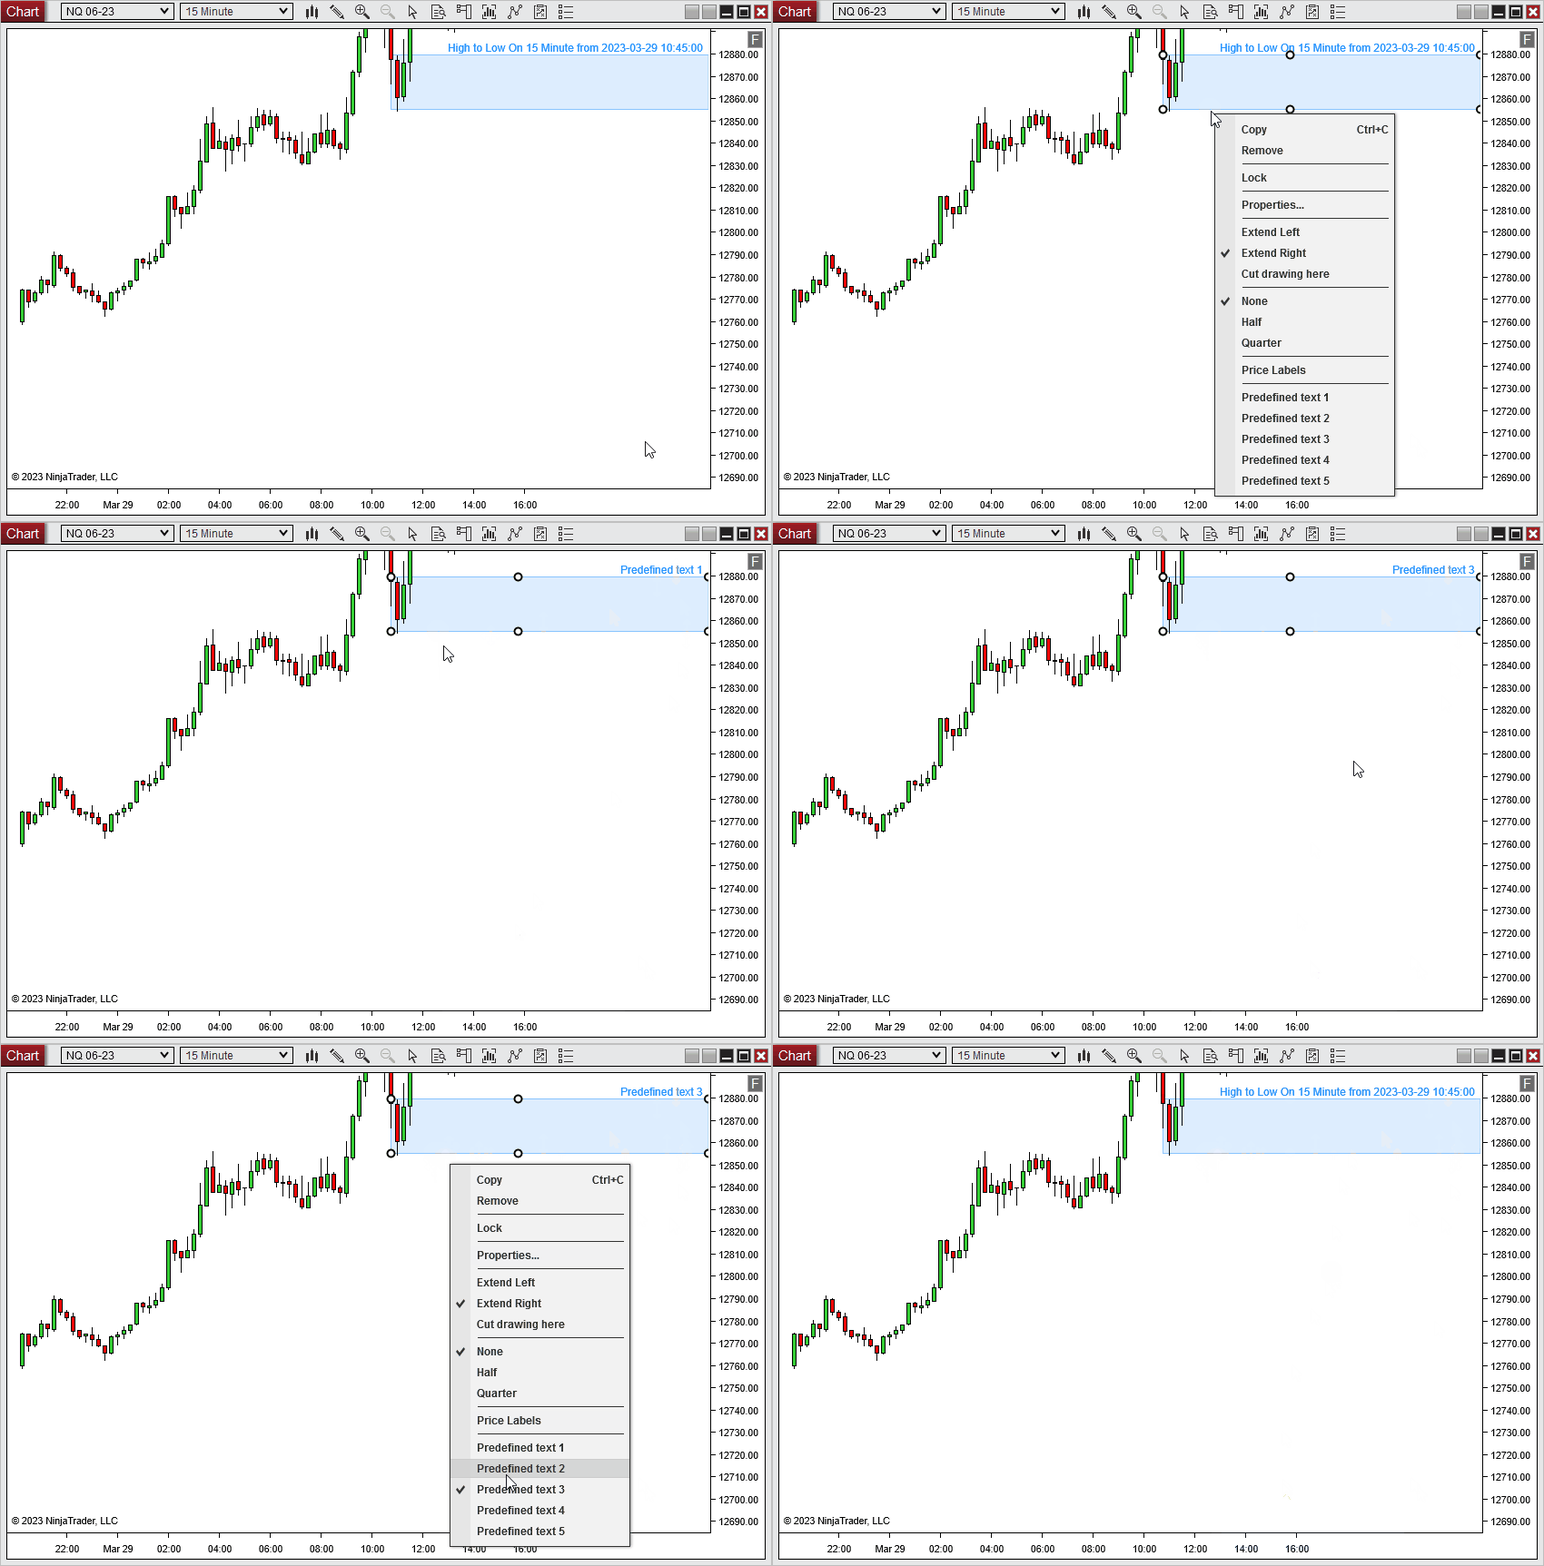
Predefined text 1 to 5
You can now define up to 5 custom text fields and when saved as the Default Template, these predefined text fields can quickly be selected from the right click context menu.
1 review for Extending Horizontal Line drawing tool for NinjaTrader 8
Only logged in customers who have purchased this product may leave a review.



Scott (verified owner) –
This is an excellent tool that has saved me a ton of time